AUD/NZD Price Analysis: 50-day SMA joins falling wedge resistance to challenge bulls under 1.0700
- AUD/NZD remains bid above 21-day SMA, about to confirm the bullish chart pattern.
- RBA minutes flashed upbeat signals but Governor Lowe praised present rates.
- New Zealand’s Credit Card Spending recovered to -9.2% in June.
- The formation’s support, 200-day SMA acts as the key downside levels to watch during the pair’s fall.
AUD/NZD prints 0.14% gains to 1.0682 during the early Tuesday’s trading session. The pair recently benefited from the RBA minutes and comments from the RBA Governor Philip Lowe. In doing so, better than forecast and prior readings of New Zealand’s early signal to retail sales got fewer audience accolades.
RBA policymakers preferred not to announce any fresh stimulus despite the coronavirus (COVID-19) resurgence. On the other hand, Governor Lowe defied clues of any preference to a weaker Australia dollar considering the fundamentals. Elsewhere, the New Zealand’s Credit Card Spending bounced off -21.1% in May to -9.2% in June versus -24.7% forecast.
Considering the pair’s sustained trading beyond 21-day SMA, coupled with bullish MACD and upbeat fundamentals, the quote is likely to cross 1.0680-1.0700 resistance area.
Following that, June 25 high surrounding 1.0790 and the previous month’s peak close to 1.0880 could offer intermediate moves during the AUD/NZD price rally towards the late-2018 top near 1.1000.
On the downside, a daily closing below a 21-day SMA level of 1.0660 can recall 1.0600 and 1.0580 on the charts. However, the bullish pattern’s support line, at 1.0550 now, can restrict the pair’s further weakness.
In a case where the bears dominate past-1.0550, a 200-day SMA level of 1.0530 will be closely watched as a break of which will divert selling pressure towards 1.0400 mark.
AUD/NZD daily chart
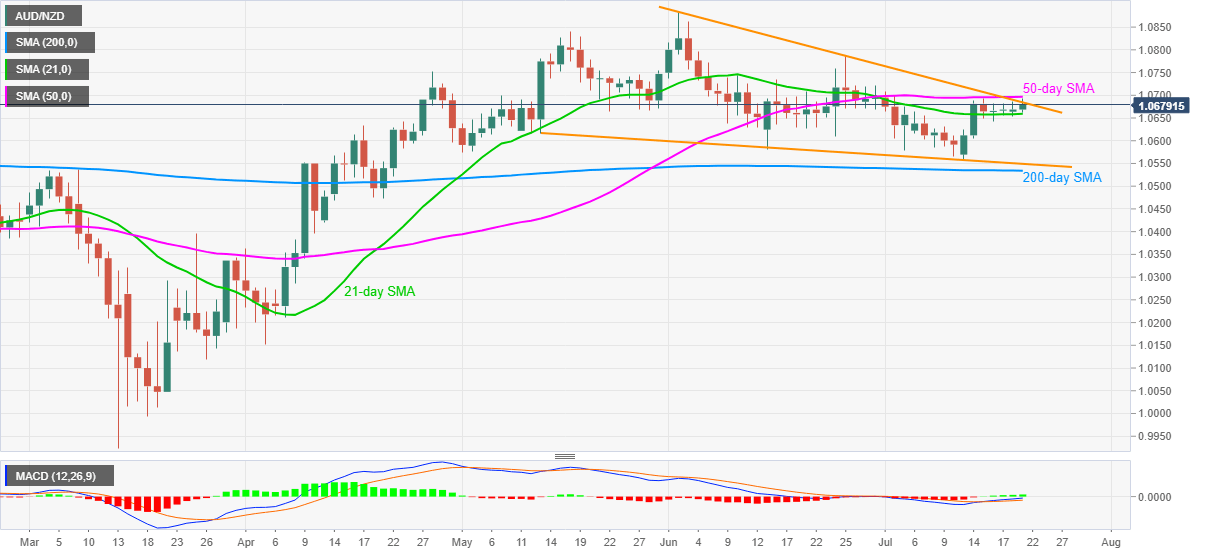
Trend: Bullish
Author

Anil Panchal
FXStreet
Anil Panchal has nearly 15 years of experience in tracking financial markets. With a keen interest in macroeconomics, Anil aptly tracks global news/updates and stays well-informed about the global financial moves and their implications.


