|

AUD/JPY technical analysis: Another run-up towards 21-DMA

  • The four-day-old support-line favor AUD/JPY to again confront 21-DMA.
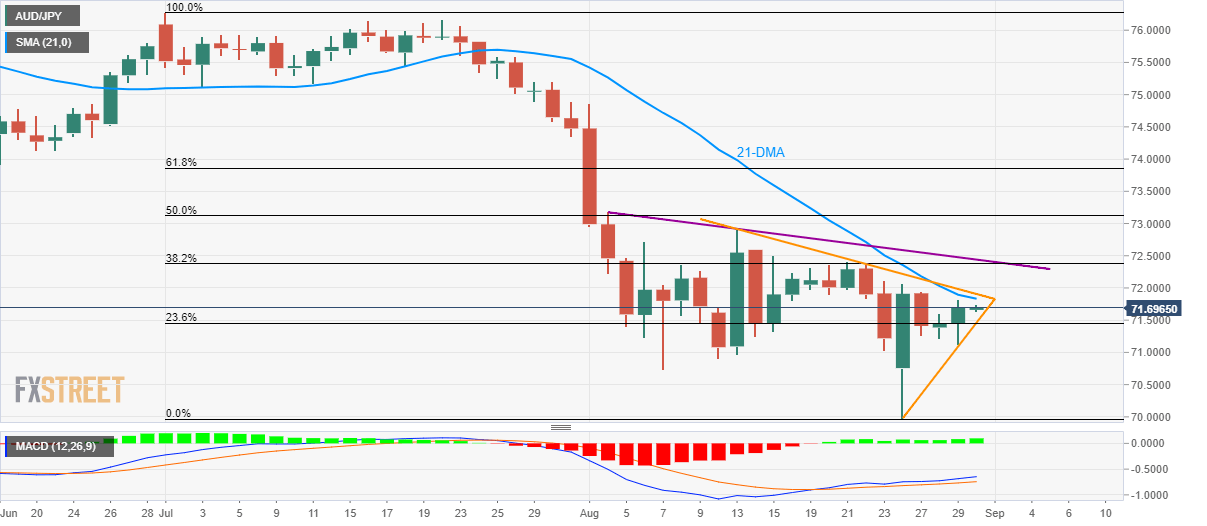
  • Downward sloping trend-lines from August 02 and 13 become additional upside barriers.

Sustained trading beyond four-day-old rising trend-line favors AUD/JPY to aim for 21-day simple moving average (DMA) as it makes the rounds to 71.70 during early Asian session on Friday.

Other than 21-DMA level of 71.83, a falling trend-line since August 13 at 71.91 and another one ranging from August 02 around 72.44 are extra upside barriers that the quote needs to conquer in order to justify its strength.

In a case where prices rally beyond 72.44, 50% Fibonacci retracement of July-August downpour, also including August 02 top, can question AUD/JPY buyers around 73.15/20.

Meanwhile, pair’s break of 71.46/45 support-zone comprising immediate rising trend-line and 23.6% Fibonacci retracement can please sellers with August 07 low surrounding 70.70 ahead of pushing them to 70.00/69.95 area including the monthly bottom.

AUD/JPY daily chart

Trend: pullback expected

Additional important levels

Overview
Today last price1.0662
Today Daily Change35 pips
Today Daily Change %0.33%
Today daily open1.0627
 
Trends
Daily SMA201.051
Daily SMA501.048
Daily SMA1001.0533
Daily SMA2001.051
Levels
Previous Daily High1.0657
Previous Daily Low1.0602
Previous Weekly High1.062
Previous Weekly Low1.0526
Previous Monthly High1.0554
Previous Monthly Low1.0383
Daily Fibonacci 38.2%1.0636
Daily Fibonacci 61.8%1.0623
Daily Pivot Point S11.0601
Daily Pivot Point S21.0574
Daily Pivot Point S31.0546
Daily Pivot Point R11.0655
Daily Pivot Point R21.0683
Daily Pivot Point R31.071

Author

Anil Panchal

Anil Panchal

FXStreet

Anil Panchal has nearly 15 years of experience in tracking financial markets. With a keen interest in macroeconomics, Anil aptly tracks global news/updates and stays well-informed about the global financial moves and their implications.

More from Anil Panchal
Share:

Editor's Picks

EUR/USD consolidates around 1.0900, bullish bias remains ahead of key US data

The EUR/USD pair is seen consolidating its strong gains registered over the past two days and oscillating in a narrow band during the Asian session on Tuesday. Spot prices currently trade around the 1.1900 mark, just below an over one-week high touched the previous day.

GBP/USD tilts bullish as markets barrel toward mid-week NFP print

GBP/USD is holding a broader bullish structure on the daily chart, with price trading well above the 50 Exponential Moving Average at 1.3507 and the 200 EMA at 1.3310, confirming the intermediate uptrend that has been in place since the November 2025 low near 1.2300. 

Gold: Will US Retail Sales data propel it above $5,100?

Gold hovers below weekly highs of $5,087 early Tuesday, await US Retail Sales data. The US Dollar enters a downside consolidation phase amid persistent Japanese Yen strength and worsening labor market. Gold settled Monday above $5,000, now looks to take out $5,100 amid bullish daily RSI.

Top Crypto Gainers: World Liberty Financial, MemeCore and Quant gain momentum

World Liberty Financial, MemeCore, and Quant are leading gains over the last 24 hours as the broader cryptocurrency market stabilizes after last week’s correction. Still, the technical outlook for altcoins remains mixed due to prevailing downside pressure and vulnerable market sentiment. 

The market is buying everything again but is it dancing on a borrowed floor

The market has a short memory and a fast trigger finger. Last week’s liquidation barely cooled before risk came roaring back, pushing the S&P toward record territory and reinstalling Big Tech as the engine of choice. This is not discovery. It is re exposure.

Ripple exposed to volatility amid low retail interest, modest fund inflows

Ripple (XRP) is extending its intraday decline to around $1.40 at the time of writing on Monday amid growing pressure from the retail market and risk-off sentiment that continues to keep investors on the sidelines.