|

AUD/JPY technical analysis: 100-HMA exerts immediate downside pressure

  • AUD/JPY remains on the back foot with its repeated failures to cross 100-HMA.
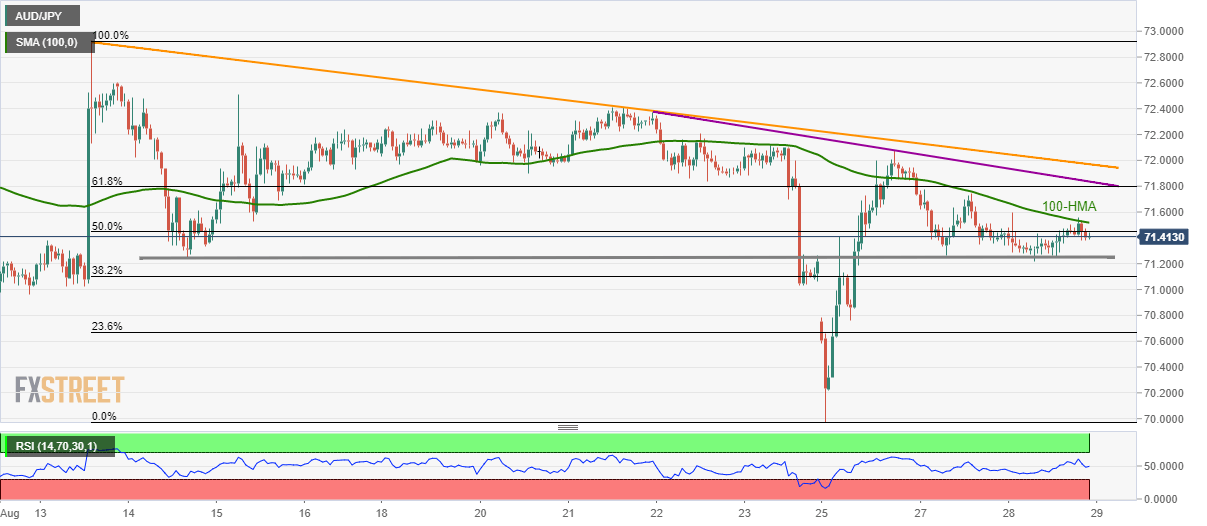
  • A horizontal line around 71.25 has been acting as the key support since August 14.

With the 100-hour moving average (HMA) aptly limiting the AUD/JPY pair’s immediate upside, the quote stays on the back foot while taking rounds to 71.41 during Asian morning on Thursday.

Even so, a two-week-old horizontal-line near 71.25 limits the AUD/JPY pair’s near-term declines, which if ignored could drag prices to 71.00 round-figure.

It should also be noted that the week-start gap near 70.75 can question pair’s further downside, if not then 70.00 will become sellers’ favorite.

On the upside, successful break of 100-HMA, at 71.52 now, propels the AUD/JPY pair towards 61.8% Fibonacci retracement level of its downpour between August 13 and 25, at 71.80.

In a case where buyers dominate beyond 71.80, the downward sloping trend-lines since August 21 and August 13, around 71.84 and 71.97 respectively, will be in the spotlight.

AUD/JPY hourly chart

Trend: sideways

Additional important levels

Overview
Today last price71.41
Today Daily Change0.00
Today Daily Change %0.00%
Today daily open71.41
 
Trends
Daily SMA2072.06
Daily SMA5074.06
Daily SMA10075.55
Daily SMA20077.39
Levels
Previous Daily High71.94
Previous Daily Low71.26
Previous Weekly High72.41
Previous Weekly Low71.03
Previous Monthly High76.28
Previous Monthly Low74.35
Daily Fibonacci 38.2%71.52
Daily Fibonacci 61.8%71.68
Daily Pivot Point S171.13
Daily Pivot Point S270.85
Daily Pivot Point S370.45
Daily Pivot Point R171.82
Daily Pivot Point R272.22
Daily Pivot Point R372.5

Author

Anil Panchal

Anil Panchal

FXStreet

Anil Panchal has nearly 15 years of experience in tracking financial markets. With a keen interest in macroeconomics, Anil aptly tracks global news/updates and stays well-informed about the global financial moves and their implications.

More from Anil Panchal
Share:

Editor's Picks

EUR/USD treads water around 1.1900

EUR/USD edges a tad lower around the 1.1900 area, coming under mild pressure despite the US Dollar keeps the offered stance on turnaround Tuesday. On the US data front, December Retail Sales fell short of expectations, while the ADP four week average printed at 6.5K.

GBP/USD looks weak near 1.3670

GBP/USD trades on the back foot around the 1.3670 region on Tuesday. Cable’s modest retracement also comes in tandem with the decent decline in the Greenback. Moving forward, the US NFP and CPI data in combination with key UK releases should kee the quid under scrutiny in the next few days.

Gold the battle of wills continues with bulls not ready to give up

Gold comes under marked selling pressure on Tuesday, giving back part of its recent two day advance and threatening to challenge the key $5,000 mark per troy ounce. The yellow metal’s correction follows a better tone in the risk complex, a lower Greenback and shrinking US Treasuty yields.

AI Crypto Update: BankrCoin, Pippin surge as sector market cap steadies above $12B

The Artificial Intelligence (AI) segment is largely on the back foot with major coins such as Bittensor (TAO) and Internet Computer (ICP) extending losses amid a sticky risk-off sentiment.

Dollar drops and stocks rally: The week of reckoning for US economic data

Following a sizeable move lower in US technology Stocks last week, we have witnessed a meaningful recovery unfold. The USD Index is in a concerning position; the monthly price continues to hold the south channel support.

XRP holds $1.40 amid ETF inflows and stable derivatives market

Ripple trades under pressure, with immediate support at $1.40 holding at the time of writing on Tuesday. A recovery attempt from last week’s sell-off to $1.12 stalled at $1.54 on Friday, leading to limited price action between the current support and the resistance.