AUD/JPY Price Analysis: Friday's bullish close looking for a rebound into 98.00


  • The AUD/JPY saw a late break higher in Friday's broad-market sentiment recovery.
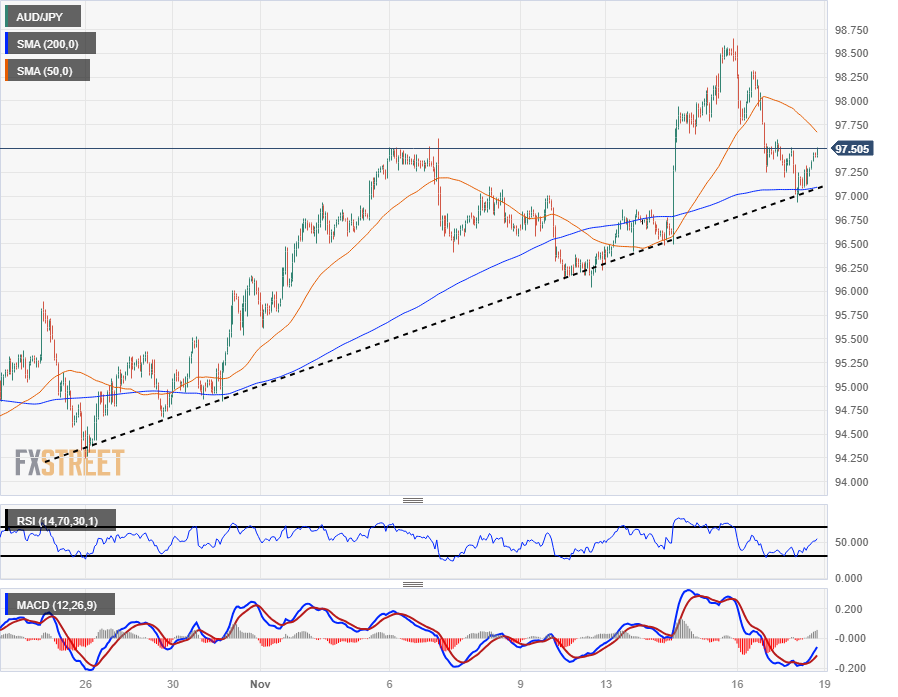
  • The Aussie is catching a bounce from the 200-hour SMA and a rising trendline.
  • The technicals are leaning bullish with more upside on the cards, but headwinds remain.

The AUD/JPY snuck over the 97.50 level just ahead of the Friday closing bell, trying to claw back some of the midweek's losses after the pair tumbled from a Wednesday peak of 98.66.

The AUD/JPY closed out the trading week with some gains, up nearly 1.2% from Monday's opening bids near 96.40, but the back half of the week was marred by a 1.75% decline that only saw a minor paring back in late Friday trading.

With the Aussie (AUD) bouncing off a technical confluence of the 200-hour Simple Moving Average (SMA) and a rising trendline drawn from late October's swing low into 94.25, the pair is set for a bullish continuation as long as broad-market fundamentals keep risk appetite on the high side.

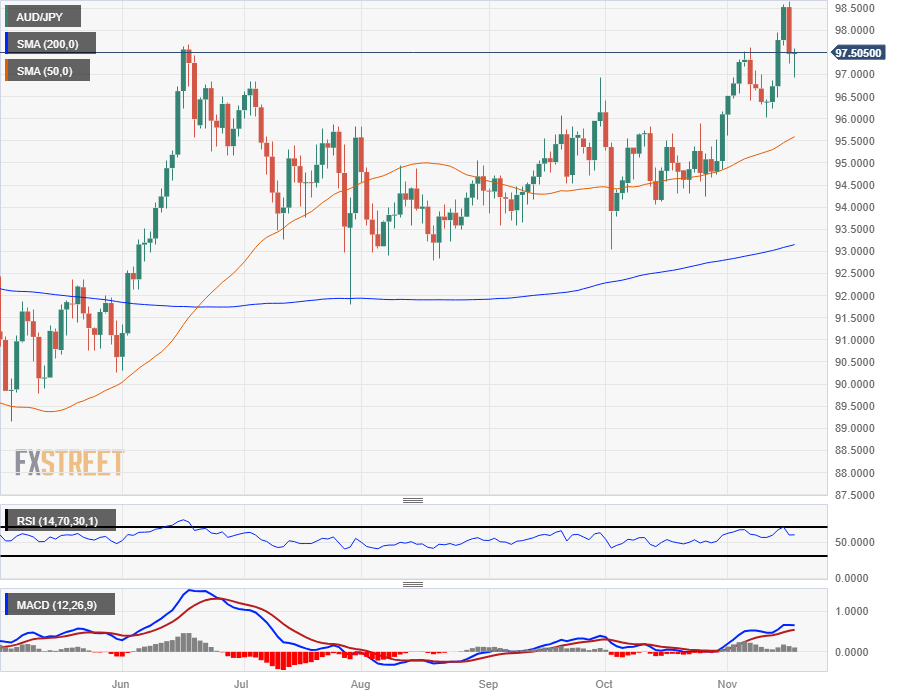
Daily candlesticks are flashing warning signs that the current bullish push could be running out of gas.

The AUD/JPY is at risk of getting pulled back towards the 50-day SMA near 95.50, and long-term technical support is far below current price action at the 200-day SMA rising from 93.00.

November's rise out of October's consolidation phase could face a near-term bearish breakdown, with the last swing low into the 96.00 handle acting as the immediate support level for bears to beat.

AUD/JPY Hourly Chart

AUD/JPY Daily Chart

AUD/JPY Technical Levels

AUD/JPY

Overview
Today last price 97.5
Today Daily Change 0.04
Today Daily Change % 0.04
Today daily open 97.46
 
Trends
Daily SMA20 96.26
Daily SMA50 95.53
Daily SMA100 94.99
Daily SMA200 93.12
 
Levels
Previous Daily High 98.66
Previous Daily Low 97.24
Previous Weekly High 97.6
Previous Weekly Low 96.04
Previous Monthly High 96.42
Previous Monthly Low 93.05
Daily Fibonacci 38.2% 97.79
Daily Fibonacci 61.8% 98.12
Daily Pivot Point S1 96.92
Daily Pivot Point S2 96.37
Daily Pivot Point S3 95.5
Daily Pivot Point R1 98.34
Daily Pivot Point R2 99.21
Daily Pivot Point R3 99.75


Share: Feed news

Information on these pages contains forward-looking statements that involve risks and uncertainties. Markets and instruments profiled on this page are for informational purposes only and should not in any way come across as a recommendation to buy or sell in these assets. You should do your own thorough research before making any investment decisions. FXStreet does not in any way guarantee that this information is free from mistakes, errors, or material misstatements. It also does not guarantee that this information is of a timely nature. Investing in Open Markets involves a great deal of risk, including the loss of all or a portion of your investment, as well as emotional distress. All risks, losses and costs associated with investing, including total loss of principal, are your responsibility. The views and opinions expressed in this article are those of the authors and do not necessarily reflect the official policy or position of FXStreet nor its advertisers. The author will not be held responsible for information that is found at the end of links posted on this page.

If not otherwise explicitly mentioned in the body of the article, at the time of writing, the author has no position in any stock mentioned in this article and no business relationship with any company mentioned. The author has not received compensation for writing this article, other than from FXStreet.

FXStreet and the author do not provide personalized recommendations. The author makes no representations as to the accuracy, completeness, or suitability of this information. FXStreet and the author will not be liable for any errors, omissions or any losses, injuries or damages arising from this information and its display or use. Errors and omissions excepted.

The author and FXStreet are not registered investment advisors and nothing in this article is intended to be investment advice.

Recommended content


Recommended content

Editors’ Picks

EUR/USD turns negative near 1.0760

EUR/USD turns negative near 1.0760

The sudden bout of strength in the Greenback sponsored the resurgence of the selling pressure in the risk complex, dragging EUR/USD to the area of daily lows near 1.0760.

EUR/USD News

GBP/USD comes under pressure and challenges 1.2500

GBP/USD comes under pressure and challenges 1.2500

GBP/USD now rapidly loses momentum and gives away initial gains, returning to the 1.2500 region on the back of the strong comeback of the US Dollar.

GBP/USD News

Gold retreats from highs on stronger Dollar, yields

Gold retreats from highs on stronger Dollar, yields

XAU/USD trims part of its initial advance in response to the jump in the Dollar's buying interest and the re-emergence of the upside pressure in US yields.

Gold News

XRP tests support at $0.50 as Ripple joins alliance to work on blockchain recovery

XRP tests support at $0.50 as Ripple joins alliance to work on blockchain recovery

XRP trades around $0.5174 early on Friday, wiping out gains from earlier in the week, as Ripple announced it has joined an alliance to support digital asset recovery alongside Hedera and the Algorand Foundation. 

Read more

Week ahead – US inflation numbers to shake Fed rate cut bets

Week ahead – US inflation numbers to shake Fed rate cut bets

Fed rate-cut speculators rest hopes on US inflation data. After dovish BoE, pound traders turn to UK job numbers. Will a strong labor market convince the RBA to hike? More Chinese data on tap amid signs of slow Q2 start.

Read more

Forex MAJORS

Cryptocurrencies

Signatures