Apple Stock Earnings Preview: AAPL advances in premarket after beat
- AAPL stock reports earnings post-market on October 27.
- Wall Street expects $1.27 in EPS on $88.77 billion in revenue.
- The week has already seen poor performances by Alphabet, Microsoft and Meta Platforms.

UPDATE: Despite selling off 5% in the afterhours market upon releasing quarterly earnings on Thursday evening, Apple stock is advancing 0.7% in the premarket on Friday. Shares are now at $145.80 after closing the regular session on Thursday down 3.1% at $144.80. The fiscal fourth quarter earnings came in 2 cents ahead of consensus at $1.29 a share. Revenue of $90.15 billion also beat consensus by $1.37 billion. Overall, the quarter was solid, but some parts of the market were worried that management did not provide clear guidance on the following holiday quarter. For the reported quarter, every segment raised revenue compared to the year ago quarter except for the iPad division.
The entire market now hinges on Apple (AAPL). This momentous earnings week has seen Alphabet (GOOGL), Microsoft (MSFT) and then Meta Platforms (META) sell-off in major fashion. The latter is down 22% today after delivering earnings late Wednesday that seemed to impress exactly no one.
See you tomorrow $AAPL ☠️ pic.twitter.com/zjHkGbC1mr
— LIA (@Liathetrader) October 27, 2022
Still, it should be lost on precisely no one that part of Meta's lackluster recent performance is due to Apple's clampdown on privacy issues which has become a major headwind to digital advertisers like Meta. After restricting applications on iPhones from retrieving essential personal data, Apple has increased its focus on its own ad business. No one wants to say the M word out loud, but until regulators get serious, Apple has the best chance of besting this quarter's earnings call compared to its cohort. The premier consumer tech maker will unveil its fiscal fourth quarter after the market closes on Thursday, October 27.
Apple stock earnings preview
The general feeling is that the market cannot take another mega-cap miss this week. Early in the week pundits were declaring a bear market rally was set to continue. The S&P 500 has already added 300 points since October 13, so really the past two weeks already amount to a rally. One more miss from Apple, however, might have the effect of leading to a new marketwide low.
Wall Street has not set the bar too high for Apple, which just released the iPhone 14 last month. Analyst consensus puts the EPS for the quarter at $1.27. This is ahead of the $1.20 produced in the most recent quarter and the $1.24 a share reported in the same quarter last year. Taking inflation into account then, Wall Street is expecting an earnings decrease from last year. This would seem to give Apple the upper hand with respect to reporting a beat on the bottom line, but of course, the strong US Dollar will likely have a major effect on its foreign profits.
The $88.77 billion expected for revenue this quarter is well ahead of the $83.36 billion delivered one year ago, but again that is tempered by this past year's sharp inflation jump. For the full year, analysts expect $392.78 billion in revenue for fiscal 2022 and $411.63 billion for fiscal 2023. Any change to the guidance for the next fiscal year will have a major effect on the market's temperament. Of course, a beat and raise are what the market is hoping for.
Because the iPhone 14 was just released and was followed shortly thereafter with rumors that Apple had cut production levels for its iPhone 14 Plus model, shareholders and analysts alike will greatly focus on whatever CEO Tim Cook says regarding the demand for its most popular product. In fact, any color regarding the iPhone 14 might decided the direction of the AAPL stock price.
Apple stock forecast
AAPL stock is sitting between two wide support and resistance levels. First on the topside is the $176 level reached on August 17 before a sell-off ensued. On the bottom side is the $130 level where Apple stock found support on June 16 and 17. In between are the 50-day moving average at $152.76. Apple shares have not made it above this barrier since dropping below on September 13. On the underside is the 20-day moving average at $143.60. Both of these moving averages could also become significant depending on the direction of the post-market move.
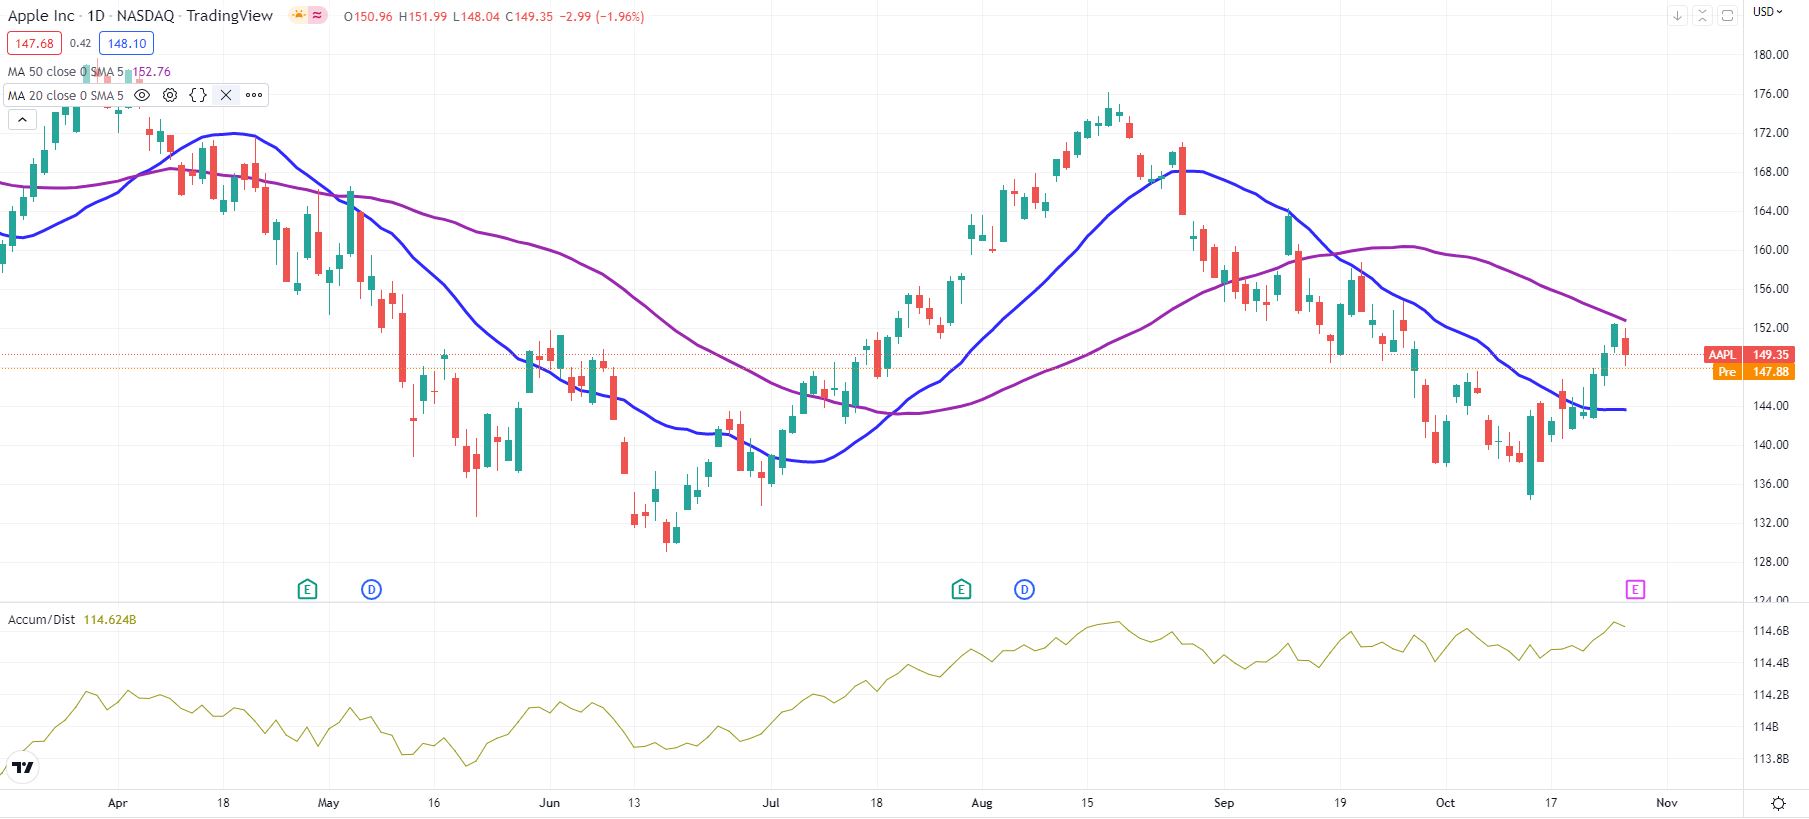
AAPL daily chart
Author

Clay Webster
FXStreet
Clay Webster grew up in the US outside Buffalo, New York and Lancaster, Pennsylvania. He began investing after college following the 2008 financial crisis.


