Apple (AAPL) Stock Price: Post-earnings slide stalls at key support, bears target 200-day MA
- Apple shares have not been rewarded for a stellar earnings release.
- AAPL is down nearly $10 post-earnings.
- If it breaks out of range, it may target $120 and below.

Apple (NASDAQ: AAPL) reported Q1 2021 earnings after the market closed on Wednesday, April 28, and the company lived up to its reputation. Apple easily beat analyst estimates, posting earnings per share of $1.40 versus forecasts for $0.99. Apple revenue came in for the first quarter at $89.58 billion versus a forecast of $77.36 billion. Not really a beat but a smash and grab. The shares quickly rallied to $137 straight after the release but have since slid back consistently and now AAPL shares are trading at $128.
Before we forget, Apple also raised its dividend and added a cool $90 billion to its buyback program. All in all, looks pretty bullish. So why the sell-off?
Apple (AAPL) stock forecast
It is never a good sign when a financial asset, any asset, reacts badly to good news. Clearly, this earnings release was very good news. Analysts did begin to comment that the results might actually be too good (is there such a thing?) and make 2022 comparisons and pace of growth hard to sustain. Well, that is a good problem to have for any company.
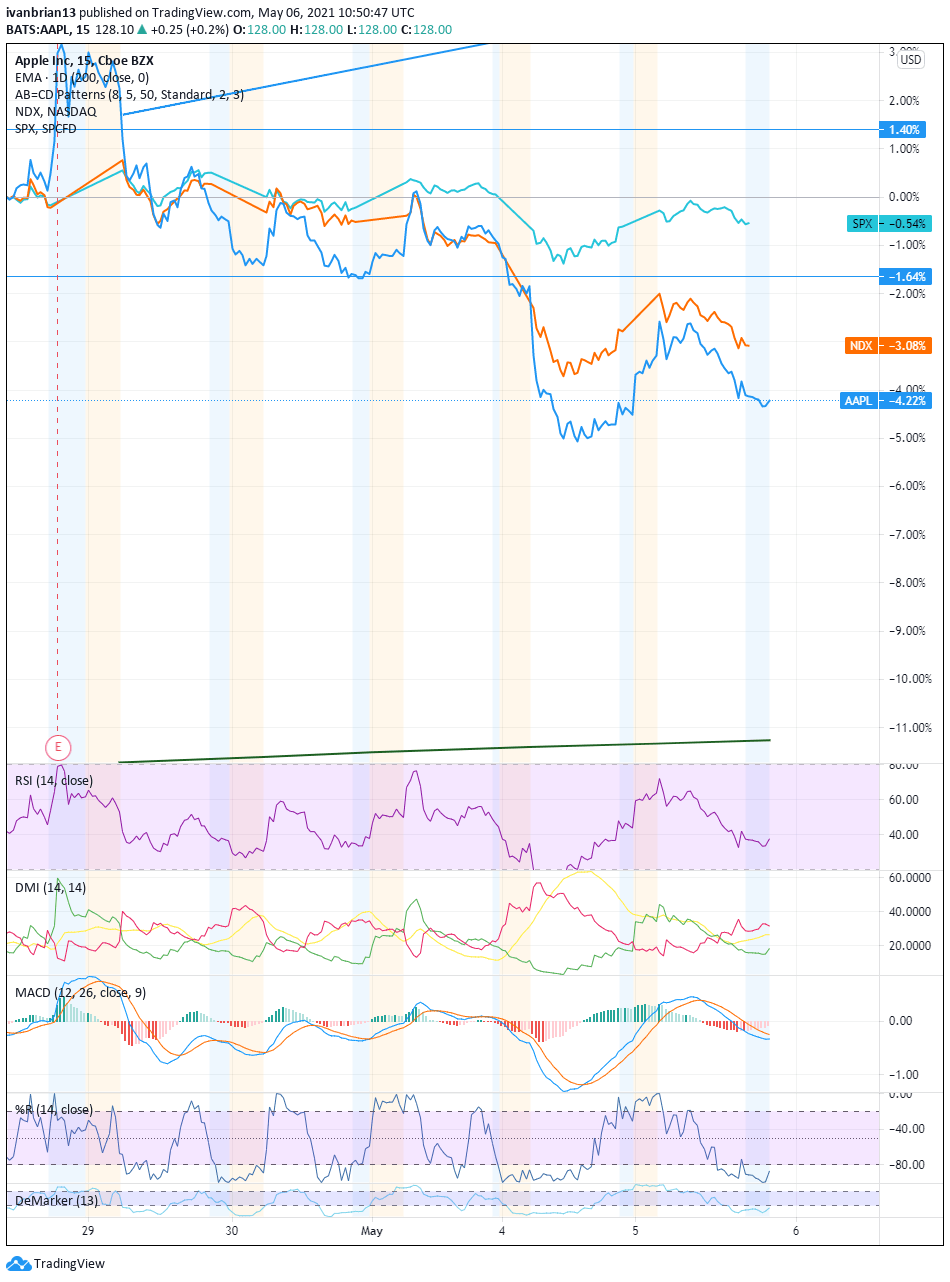
The fact remains though that AAPL has not been rewarded post results. Was everything already priced into Apple shares? Given the scale and size of the beat coupled with the dividend and buyback, one would have to think no. The broader market has retraced with the Nasdaq struggling for momentum. But AAPL shares have actually underperformed the Nasdaq since the earnings release as can be seen from the chart below. Since the earnings release, AAPL shares are down 4.2%, while the Nasdaq is down 3.1%. The S&P 500 is down only -0.5% since AAPL earnings.
No matter what way you look at it, the reaction to Apple's earnings is hard to fathom. But price is the ultimate indicator, and the price is lower. Hence, traders must act accordingly.
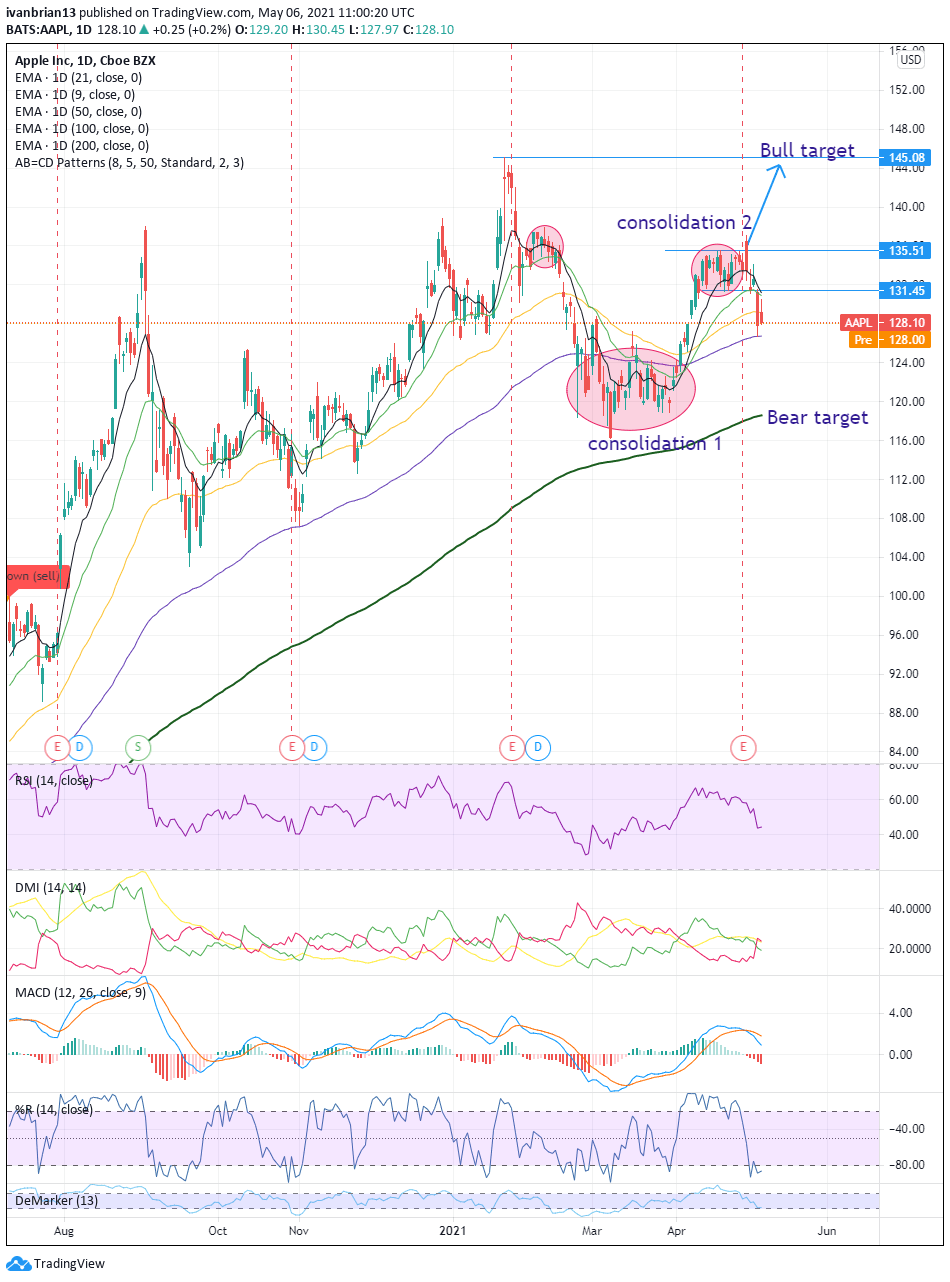
AAPL has broken out of the second consolidation phase shown below. Given the strength of earnings, most assumed the price would break higher to the $145 and above target, but now it is time to recalibrate the trading strategy.
AAPL shares broke lower and stalled perfectly at the 100-day moving average support line. The short-term trading trend is now bearish as can be seen from the break of the 9 and 21-day moving averages (MA). These and in particular the 9-day MA can be used as a resistance level to enter new short positions. A break here will see a move back into the $131-135 range, and both levels can be used to play the range and any potential breakouts.
But given the reaction to the earnings and the Moving Average Convergence Divergence (MACD) indicator crossing into a bearish signal, better to trade from the short side. The Directional Movement Index (DMI) has also crossed negatively with the ADX line showing the trend is reasonably strong, as it is above 25.
That means initiating positions at the 9-day MA with a stop just above and reversing on a break as mentioned. Another bearish strategy is to trade a break of the 100-day moving average at $126.73. Bulls can use this support level to initiate long positions with a stop just below.
The ultimate aim is the first consolidation phase shown and the 200-day moving average at $118.59.
At the time of writing, the author has no position in any stock mentioned in this article and no business relationship with any company mentioned. The author has not received compensation for writing this article, other than from FXStreet.
This article is for information purposes only. The author and FXStreet are not registered investment advisors and nothing in this article is intended to be investment advice. It is important to perform your own research before making any investment and take independent advice from a registered investment advisor.
FXStreet and the author do not provide personalized recommendations. The author makes no representations as to accuracy, completeness, or the suitability of this information. FXStreet and the author will not be liable for any errors, omissions or any losses, injuries or damages arising from this information and its display or use. The author will not be held responsible for information that is found at the end of links posted on this page.
Errors and omissions excepted.
Premium
You have reached your limit of 3 free articles for this month.
Start your subscription and get access to all our original articles.
Author

Ivan Brian
FXStreet
Ivan Brian started his career with AIB Bank in corporate finance and then worked for seven years at Baxter. He started as a macro analyst before becoming Head of Research and then CFO.


