- Apple (AAPL) stock slides as tech dives.
- AAPL is still in a downtrend and below key moving averages.
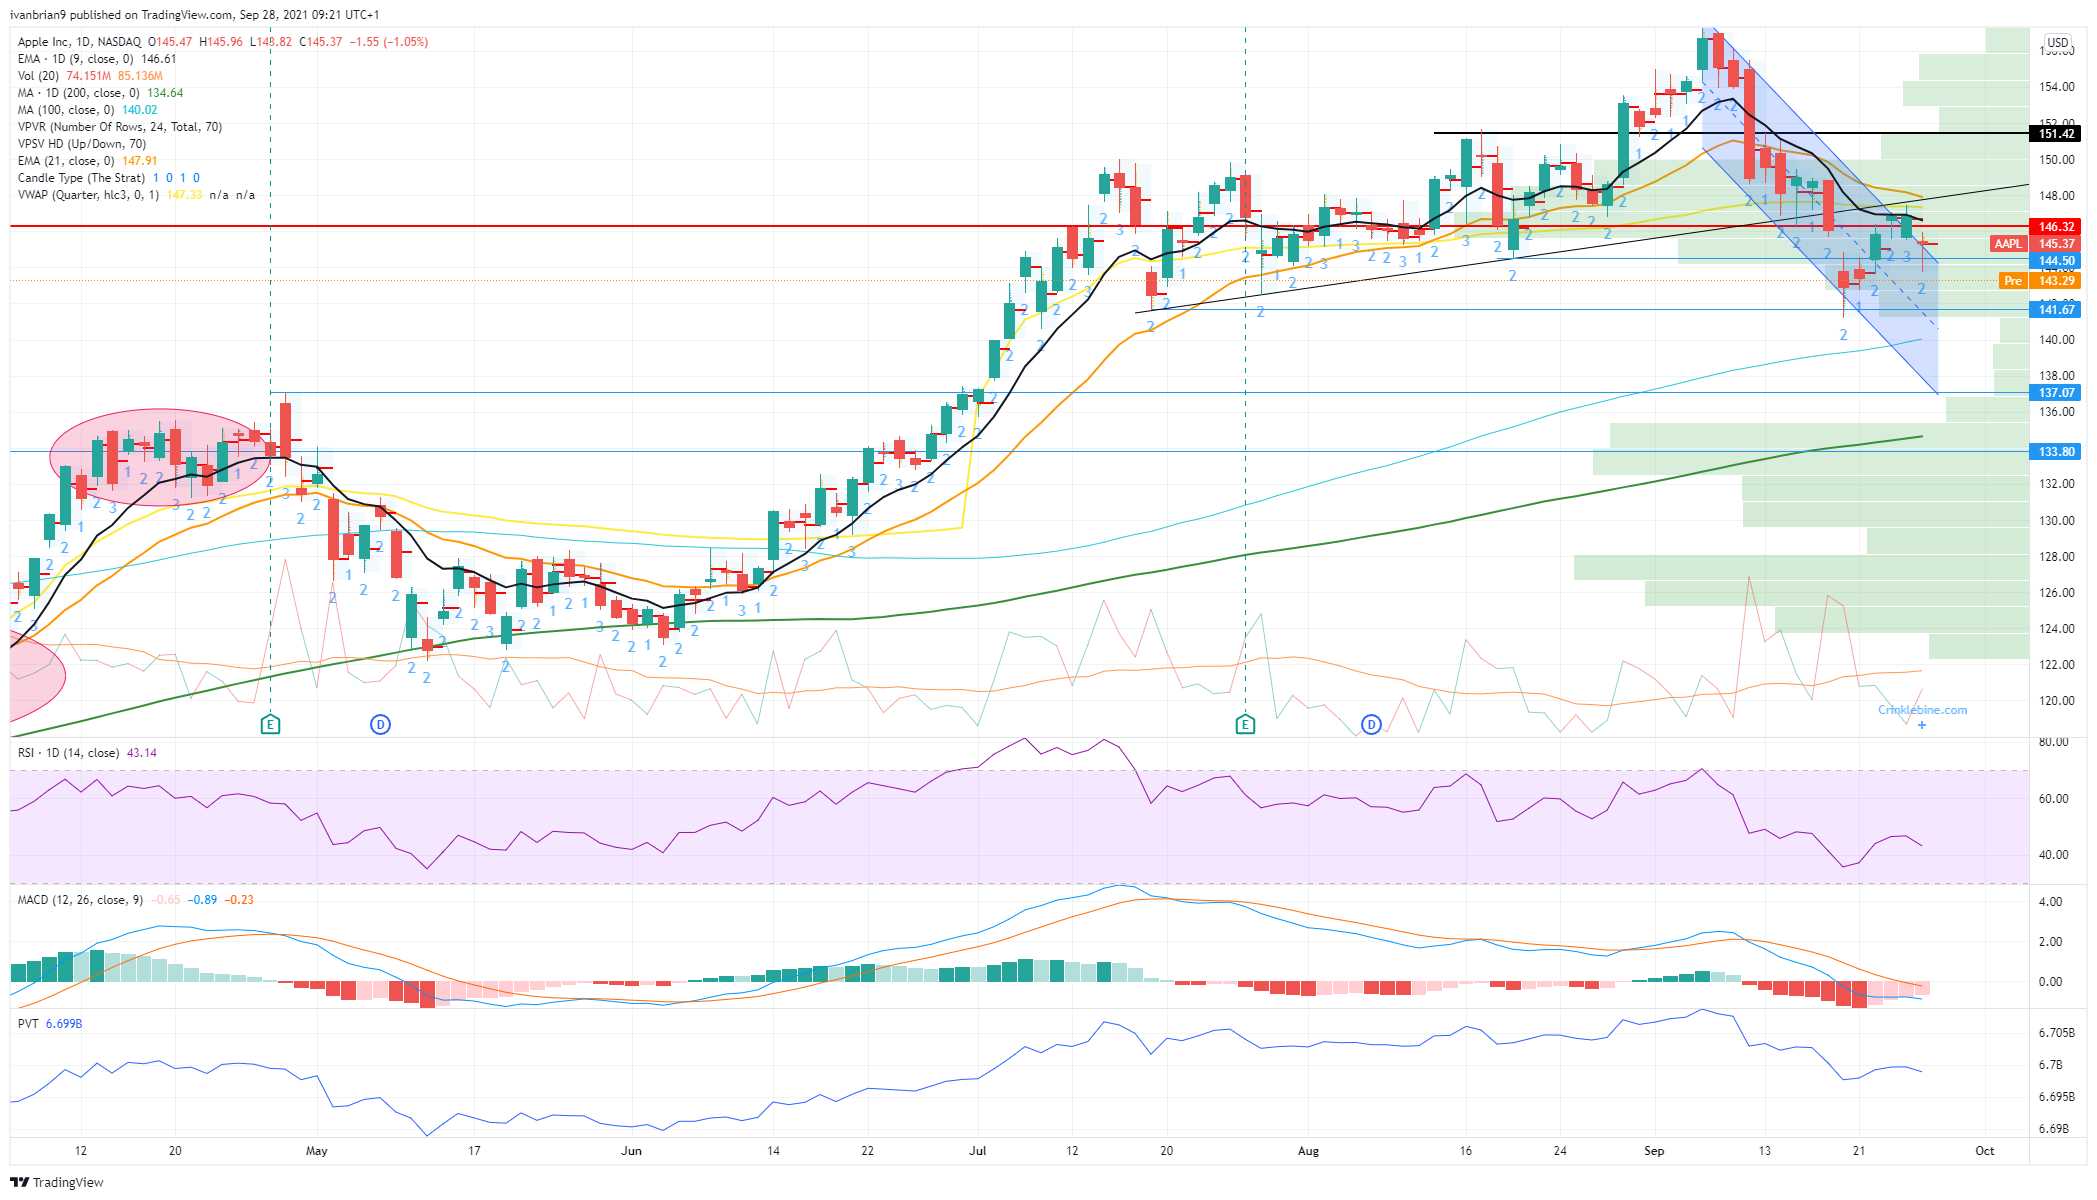
- AAPL is set for further losses and is short-term bearish.
Apple stock (AAPL) took the rise in bond yields poorly on Monday as tech stocks and the Nasdaq suffered disproportionally. The Nasdaq closed as the worst performing index of the day down 0.81%, while the Dow was actually positive and the S&P 500 lost just over a quarter of a percent. Apple dropped over one percent as concerns over the rising US 10-Year bond yield hurt interest rate sensitive tech stocks. While this should not be of much impact on Apple (AAPL) stock, it just got pulled lower by association and sector selling.
If the Nasdaq is under pressure (and remember the futures market is the driver of the stock market with about four times the volume), then to hedge positions market makers will sell the components. Apple is the number one component, representing nearly 11% of the Nasdaq 100. If traders are selling the Nasdaq 100, then Apple is going to get sold along with it. As we can see on Monday, Apple opened lower and traded in a light range for most of the session, closing out the day at $145.37 for a loss of 1.05%.
-637684137135237939.png)
Apple key statistics
| Market Cap | $2.4 trillion |
| Enterprise Value | $2.3 trillion |
| Price/Earnings (P/E) | 29 |
|
Price/Book |
38 |
| Price/Sales | 9 |
| Gross Margin | 41% |
| Net Margin | 25% |
| EBITDA | $112 billion |
| 52 week low | $103.10 |
| 52 week high | $157.26 |
| Average Wall Street rating and price target |
Buy $166.7 |
Apple stock news
This week will see increasing pre-order data for the new iPhone 13, and initial rumours are that the data should be positive. Initial data quoted by Wedbush analyst Daniel Ives sees orders 12-13% ahead and higher in China.
Apple stock forecast
Thankfully, we were not taken in by all the bullish commentary surrounding the latest iPhone release. Yes, the numbers sound positive and may provide a catalyst for upside, but our main focus is technical analysis. Apple has been in a steady downtrend since the middle of September. The recovery from the middle of last week was not matched by a recovery in the Price Volume Trend (PVT) indicator. This adds volume if prices are above the previous session close and subtracts if not. Despite the recovery in the Apple share price, the PVT was flatlining, which marks a bearish divergence.
FXStreet View: Neutral, bearish below $144.50, bullish above $150.
FXStreet Ideas: Buy a short date put on a break of $141.67 as the volume profile gets thin below this level, meaning a potential price acceleration.
Information on these pages contains forward-looking statements that involve risks and uncertainties. Markets and instruments profiled on this page are for informational purposes only and should not in any way come across as a recommendation to buy or sell in these assets. You should do your own thorough research before making any investment decisions. FXStreet does not in any way guarantee that this information is free from mistakes, errors, or material misstatements. It also does not guarantee that this information is of a timely nature. Investing in Open Markets involves a great deal of risk, including the loss of all or a portion of your investment, as well as emotional distress. All risks, losses and costs associated with investing, including total loss of principal, are your responsibility. The views and opinions expressed in this article are those of the authors and do not necessarily reflect the official policy or position of FXStreet nor its advertisers. The author will not be held responsible for information that is found at the end of links posted on this page.
If not otherwise explicitly mentioned in the body of the article, at the time of writing, the author has no position in any stock mentioned in this article and no business relationship with any company mentioned. The author has not received compensation for writing this article, other than from FXStreet.
FXStreet and the author do not provide personalized recommendations. The author makes no representations as to the accuracy, completeness, or suitability of this information. FXStreet and the author will not be liable for any errors, omissions or any losses, injuries or damages arising from this information and its display or use. Errors and omissions excepted.
The author and FXStreet are not registered investment advisors and nothing in this article is intended to be investment advice.
Recommended content
Editors’ Picks
EUR/USD holds below 1.0750 ahead of key US data

EUR/USD trades in a tight range below 1.0750 in the European session on Friday. The US Dollar struggles to gather strength ahead of key PCE Price Index data, the Fed's preferred gauge of inflation, and helps the pair hold its ground.
USD/JPY stays firm above 156.00 after BoJ Governor Ueda's comments

USD/JPY stays firm above 156.00 after surging above this level on the Bank of Japan's decision to leave the policy settings unchanged. BoJ Governor said weak Yen was not impacting prices but added that they will watch FX developments closely.
Gold price oscillates in a range as the focus remains glued to the US PCE Price Index

Gold price struggles to attract any meaningful buyers amid the emergence of fresh USD buying. Bets that the Fed will keep rates higher for longer amid sticky inflation help revive the USD demand.
Bitcoin Weekly Forecast: BTC’s next breakout could propel it to $80,000 Premium

Bitcoin’s recent price consolidation could be nearing its end as technical indicators and on-chain metrics suggest a potential upward breakout. However, this move would not be straightforward and could punish impatient investors.
US core PCE inflation set to signal firm price pressures as markets delay Federal Reserve rate cut bets

The core PCE Price Index, which excludes volatile food and energy prices, is seen as the more influential measure of inflation in terms of Fed positioning. The index is forecast to rise 0.3% on a monthly basis in March, matching February’s increase.