AMC Entertainment Holdings Forecast: AMC breaks $14.54, but RSI now overbought as shares retreat
- AMC shares rallied up to our resistance at $14.54.
- Theatre chain cannot hold the level though, for now!
- AMC showing stretched levels with RSI and CCI overbought.

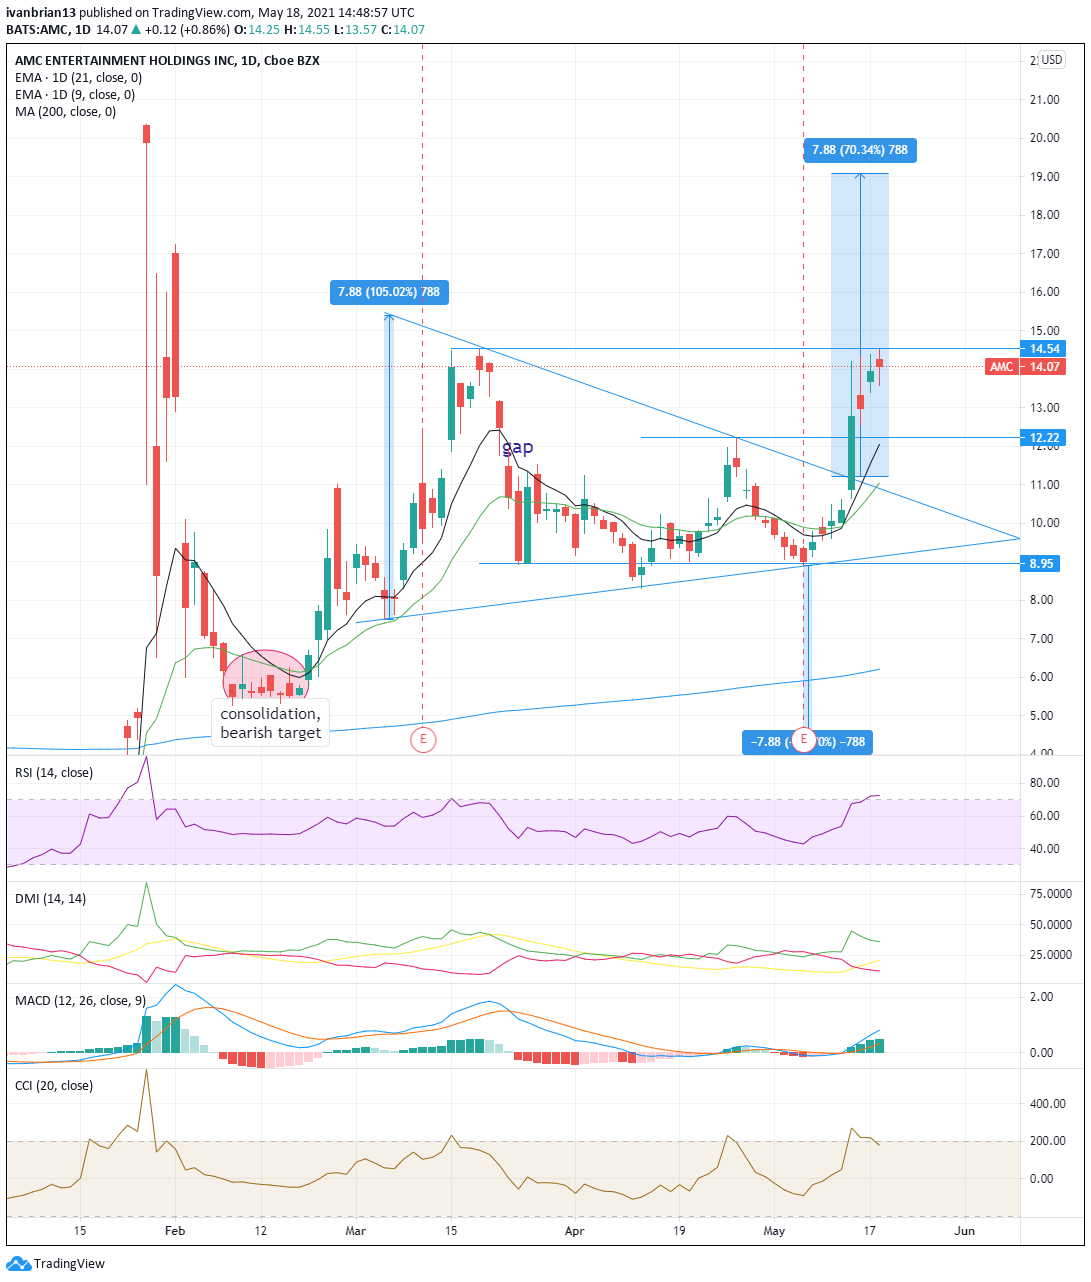
Update: AMC shares continue to exhibit textbook trading according to the charts showing these new retail traders really know what they are doing. AMC traded just up to resistance at $14.54 before retreating back. The Relative Strength Index (RSI) and Commodity Channel Index (CCI) are both indicators used to show stretched levels, ie overbought or oversold. Both RSI and CCI have moved into overbought territory on the break of $14.54 and AMC shares duly retreated.
AMC shares really are on fire these last few sessions with 7 straight days of gains now. AMC stock propelled through several key levels in exemplary technical trading.
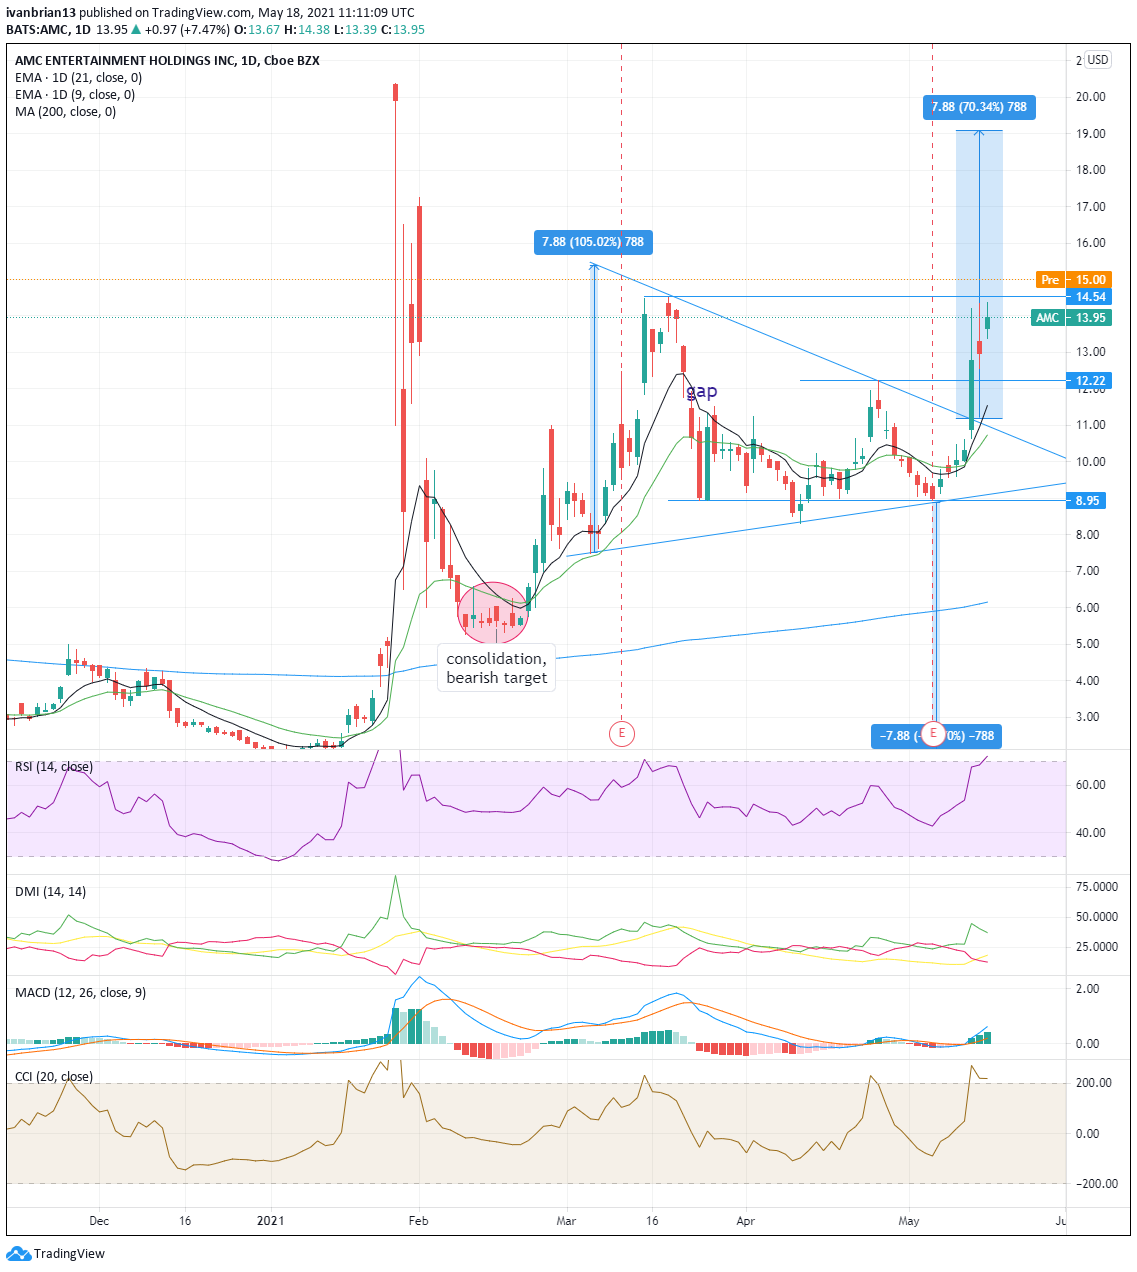
The AMC price closed Monday up 7% at $13.95, and in Tuesday's premarket it is trading at $15.42 for another 7% appreciation.
Just in case you are not too familiar with the whole GameStop and related meme stock saga, here is a little recap of the story so far from AMC's point of view. AMC is a global cinema chain and, as a result, has struggled during the global pandemic as most of these cinemas have been closed for the better part of a year. The company narrowly avoided bankruptcy through the interest of retail traders. By strongly backing it, these retail traders allowed AMC to raise capital and debt, meaning it could survive the pandemic.
AMC stock forecast
AMC announced on Thursday that it had completed the offering of 43 million shares it launched on April 29. AMC CEO and President Adam Aron said, "the additional cash raised puts AMC in a stronger position to tackle the challenges and capitalize on the opportunities that lie ahead." During the Q1 results presentation on May 6, the CEO also referred to the new wave of retail investors who had helped save the company. Adam Aron also donated money to a favoured R/WallStreetBets charity, the Dianne Fossey Gorilla Fund. This obviously endeared him further to retail investors who rewarded AMC by pushing the shares through several key resistance levels.
AMC share price exploded out of the triangle formation FXStreet had identified. The first breakout target of $12.22 was duly captured and is now the key level to hold for bulls (or should we call them "apes" as they prefer?). Consolidation for a time is fine for bulls so long as this $12.22 level is not breached. A break of $12.22 would end the bullish move and sentiment. Tuesday's premarket has seen AMC surge another 7% and take out the next key level at $14.54 in the process. As mentioned yesterday, many traders would have preferred a period of consolidation and price discovery above the $12.22 level before pushing higher. Yesterday we signaled the speed of the move was a concern, and this has been duly noted by both the Relative Strength Index (RSI) and the Commodity Channel Index (CCI). Both are now in overbought territory. This needs to be watched closely and extreme caution taken as the reversals in this name can be sharp and sudden.
The target of a triangle breakout is the size of the entry, in this case, a $7.88 range entry. The breakout target is set therefore at $19.08. This is also close to the highs seen back in January during the peak GameStop (GME) saga when AMC shares topped out at $20.36.
| Support | Resistance |
| 12.22 | 14.54 broken in premarket |
| 11.20 triangle breakout | 17.25 |
| 10.74-11.55 9 and 21 day MA | 20.36 |
| 8.95 | |
| 6.16 200-day MA | |
| 5.47 consolidation zone |
At the time of writing, the author has no position in any stock mentioned in this article and no business relationship with any company mentioned. The author has not received compensation for writing this article, other than from FXStreet.
This article is for information purposes only. The author and FXStreet are not registered investment advisors and nothing in this article is intended to be investment advice. It is important to perform your own research before making any investment and take independent advice from a registered investment advisor.
FXStreet and the author do not provide personalized recommendations. The author makes no representations as to accuracy, completeness, or the suitability of this information. FXStreet and the author will not be liable for any errors, omissions or any losses, injuries or damages arising from this information and its display or use. The author will not be held responsible for information that is found at the end of links posted on this page.
Errors and omissions excepted.
Author

Ivan Brian
FXStreet
Ivan Brian started his career with AIB Bank in corporate finance and then worked for seven years at Baxter. He started as a macro analyst before becoming Head of Research and then CFO.


