- Meme stocks suffer on Tuesday with some heavy losses.
- AMC stock loses over 8% while recent favourite BBIg fell 17%.
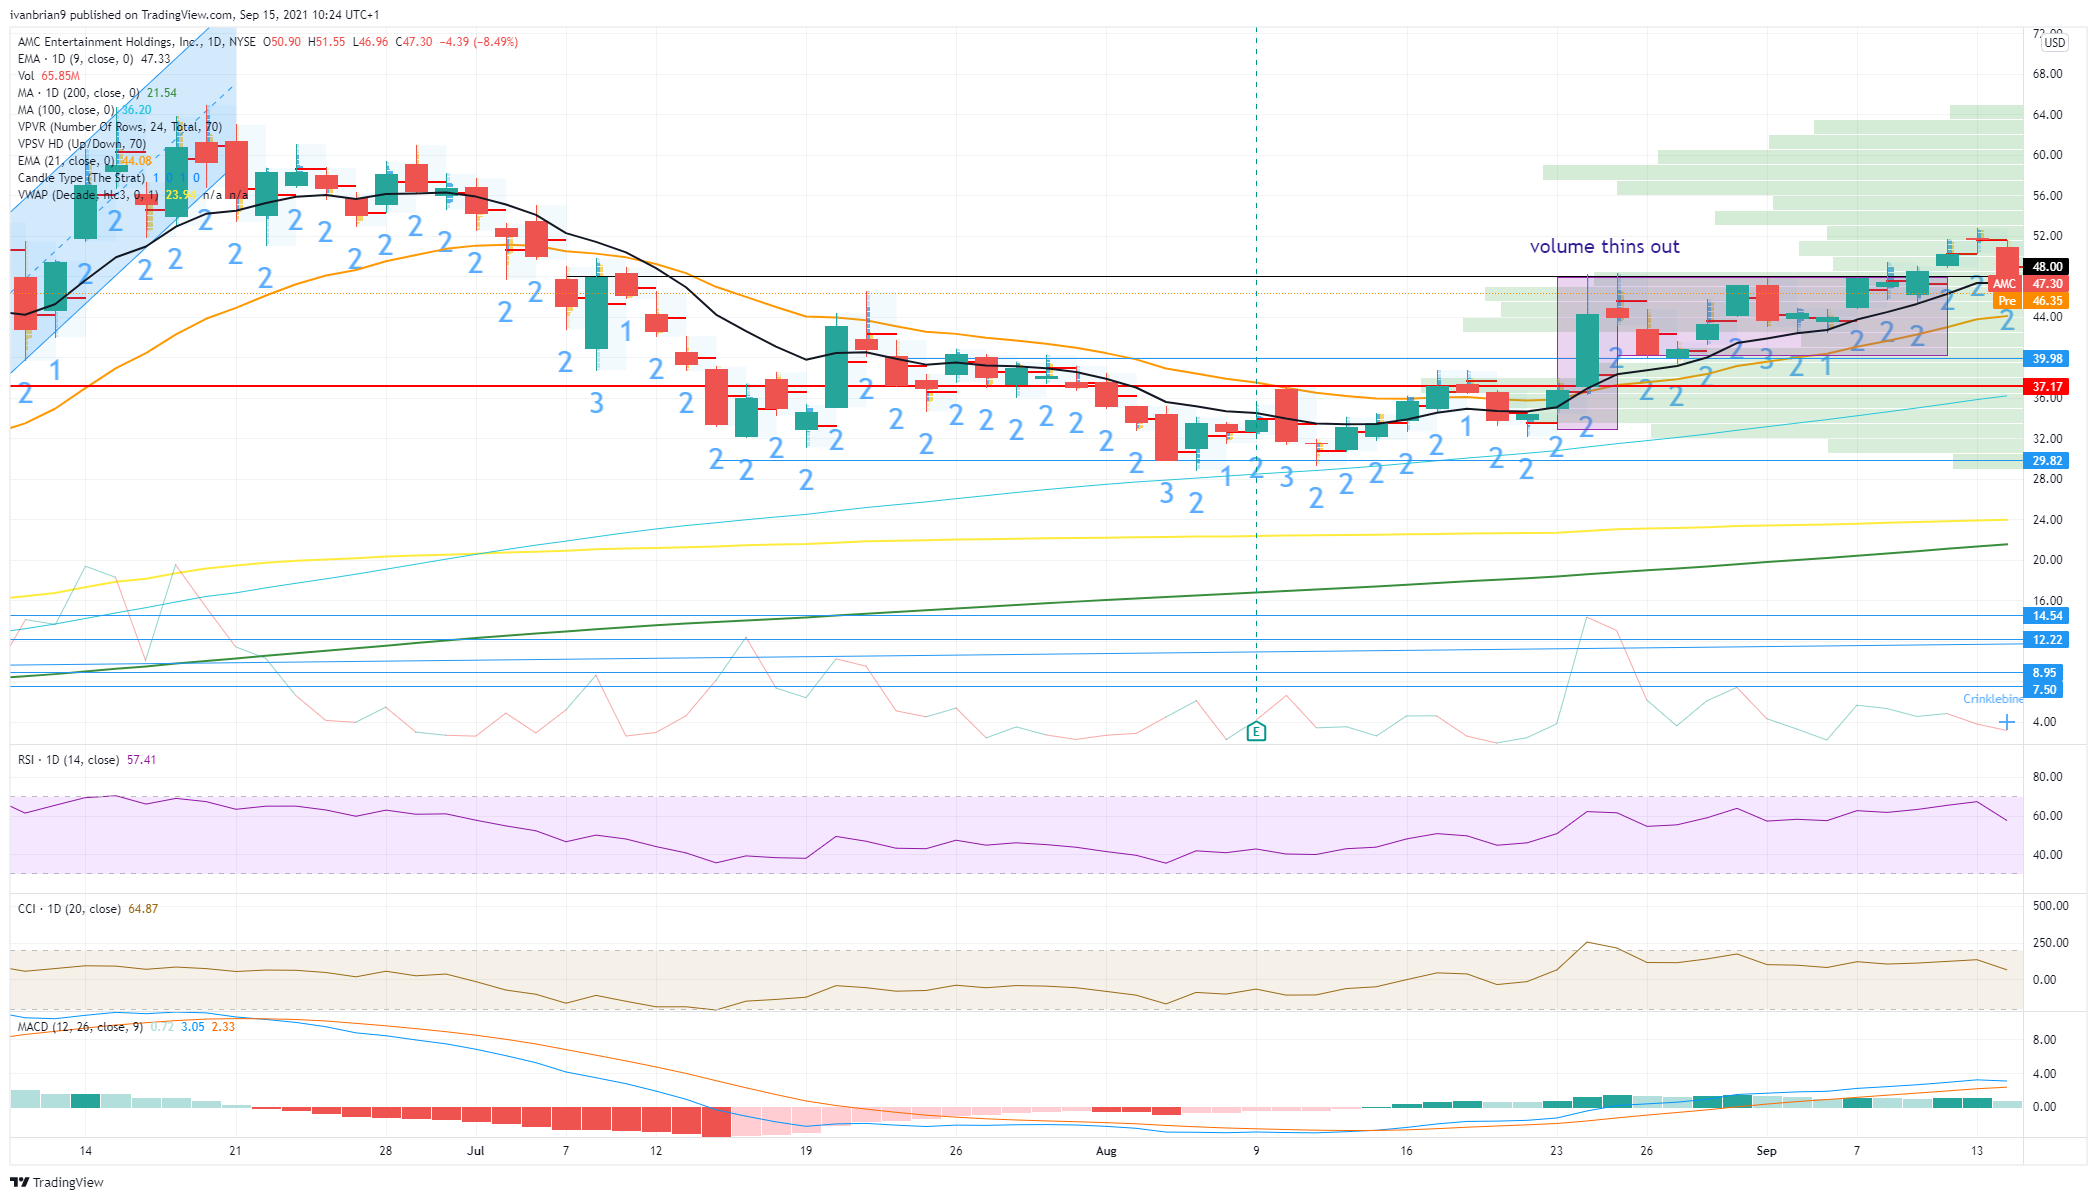
- The entertainment giant stock just breaks the key support level at $48.
Meme stocks had a tough day on Tuesday with many of the favourite names suffering some steep falls, as risk-off spread across markets. Most of these stocks are high-beta, meaning they move quite a bit more than the broad market indices. Markets were negative on Tuesday and the mood has appeared to turn negative, so meme stocks took a proportionally larger hit.
Quadruple witching is also happening on Friday and the retail meme stocks have huge open interest options positions, which will be expiring, making them very volatile in the days leading up to the event. For an explainer of quadruple witching see here.
-637672940272334644.png)
AMC 15-minute chart
The AMC 15 minute chart above shows Tuesday's session was weak throughout with little in the way of a bounce. The stock closed nearly on the lows of the day, which is never a great sign. There was talk of a negative report out on the stock from some investing websites, but AMC traders are well used to analysts calling the stock lower and ignore this and focus on momentum, so we do not give that excuse much credence. The backstory and the balance sheet difficulties are well-known. AMC is not for the faint-hearted and not for those looking at long term or value investing. It is a momentum, fast money play.
The stats below show the average wall street price target is $5.44 and has been at that level for some time, so no we do not think a negative report was the reason for Tuesday's sell-off. Rather it was a combination of risk-off mood across markets, some profit-taking from the recent spike, options related hedging ahead of Friday's quadruple witching, and just plain old shorting as the latest data shows the short interest increasing last week.
AMC key statistics
| Market Cap | $25.7 billion |
| Price/Earnings | |
| Price/Sales | 3 |
| Price/Book | |
| Enterprise Value | $36 billion |
| Gross Margin | -0.74 |
| Net Margin |
-3.15 |
| 52 week high | $72.62 |
| 52 week low | $1.91 |
| Short Interest | 18.7% Refinitiv, 20.41 % Ortex |
| Average Wall Street Rating and Price Target | Sell $5.44 |
AMC stock forecast
AMC retraced to just below our $48 support. We can say this is a retracement and a potential buy-the-dip so long as the stock does not go any lower. We can try to buy a dip here if the stock opens positively, but so far the premarket is not helping with AMC down another 2% to $46.27. This will end the bullish trend unless something turns around between now and the open. Therefore, we enter the neutral zone, the flag pattern and remain neutral until $40, at the bottom of the flag. Those looking for dips to buy can try the 21-day moving average at $44.08, but we are not very happy with that level and would prefer to wait for $38 to 40 as the volume is higher at those levels. Breaking $30 would put the stock bearish in our view.
FXStreet view: AMC bullish above $48, neutral $48 to $30, bearish below $30.
FXStreet levels: Buy the dip at $44, stop at $42. Buy the dip at $38, stop at $35. These are wide stops as this is a volatile name, so only risk what you can afford to lose.
AMC daily chart
Information on these pages contains forward-looking statements that involve risks and uncertainties. Markets and instruments profiled on this page are for informational purposes only and should not in any way come across as a recommendation to buy or sell in these assets. You should do your own thorough research before making any investment decisions. FXStreet does not in any way guarantee that this information is free from mistakes, errors, or material misstatements. It also does not guarantee that this information is of a timely nature. Investing in Open Markets involves a great deal of risk, including the loss of all or a portion of your investment, as well as emotional distress. All risks, losses and costs associated with investing, including total loss of principal, are your responsibility. The views and opinions expressed in this article are those of the authors and do not necessarily reflect the official policy or position of FXStreet nor its advertisers. The author will not be held responsible for information that is found at the end of links posted on this page.
If not otherwise explicitly mentioned in the body of the article, at the time of writing, the author has no position in any stock mentioned in this article and no business relationship with any company mentioned. The author has not received compensation for writing this article, other than from FXStreet.
FXStreet and the author do not provide personalized recommendations. The author makes no representations as to the accuracy, completeness, or suitability of this information. FXStreet and the author will not be liable for any errors, omissions or any losses, injuries or damages arising from this information and its display or use. Errors and omissions excepted.
The author and FXStreet are not registered investment advisors and nothing in this article is intended to be investment advice.
Recommended content
Editors’ Picks
EUR/USD edges lower toward 1.0700 post-US PCE

EUR/USD stays under modest bearish pressure but manages to hold above 1.0700 in the American session on Friday. The US Dollar (USD) gathers strength against its rivals after the stronger-than-forecast PCE inflation data, not allowing the pair to gain traction.
GBP/USD retreats to 1.2500 on renewed USD strength

GBP/USD lost its traction and turned negative on the day near 1.2500. Following the stronger-than-expected PCE inflation readings from the US, the USD stays resilient and makes it difficult for the pair to gather recovery momentum.
Gold struggles to hold above $2,350 following US inflation

Gold turned south and declined toward $2,340, erasing a large portion of its daily gains, as the USD benefited from PCE inflation data. The benchmark 10-year US yield, however, stays in negative territory and helps XAU/USD limit its losses.
Bitcoin Weekly Forecast: BTC’s next breakout could propel it to $80,000 Premium

Bitcoin’s recent price consolidation could be nearing its end as technical indicators and on-chain metrics suggest a potential upward breakout. However, this move would not be straightforward and could punish impatient investors.
Week ahead – Hawkish risk as Fed and NFP on tap, Eurozone data eyed too

Fed meets on Wednesday as US inflation stays elevated. Will Friday’s jobs report bring relief or more angst for the markets? Eurozone flash GDP and CPI numbers in focus for the Euro.