AI, stocks, and Gold stocks – Connected after all

AI! Computers making intelligent decisions! New paradigm! Old laws don’t apply anymore! Long live the bull market! …Really?
Yes, AI is transformative. It already starts to enhance multiple businesses, just like the Internet did many years ago. And as many thought cryptocurrencies would.
But it doesn’t mean that the huge transformation will happen overnight! Or that it fixes everything with regard to the world’s problems in general or with the economic situation.
However, as always, markets – that are ultimately made of people (and bots that were programmed by people, anyway) – are emotional in the short run. And this emotionality is what likely we have just seen when the interest in AI soared.
AI interest
We even have data to support it. Here’s how frequently “AI” has been searched with Google:
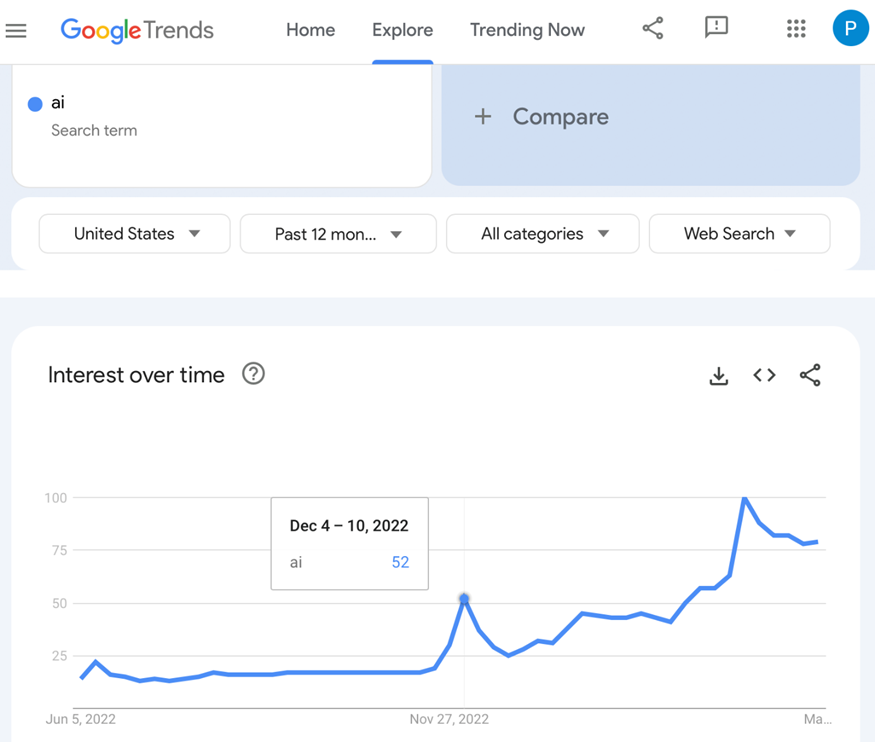
The first peak was in the Dec. 4-10, 2022 week, and the second peak was in the Apr. 16-22, 2023 week.
Now, the above is the interest in AI in general, not necessarily in investing in AI-oriented companies.
But the two are obviously connected, and the chart below proves it.
AI investment interest
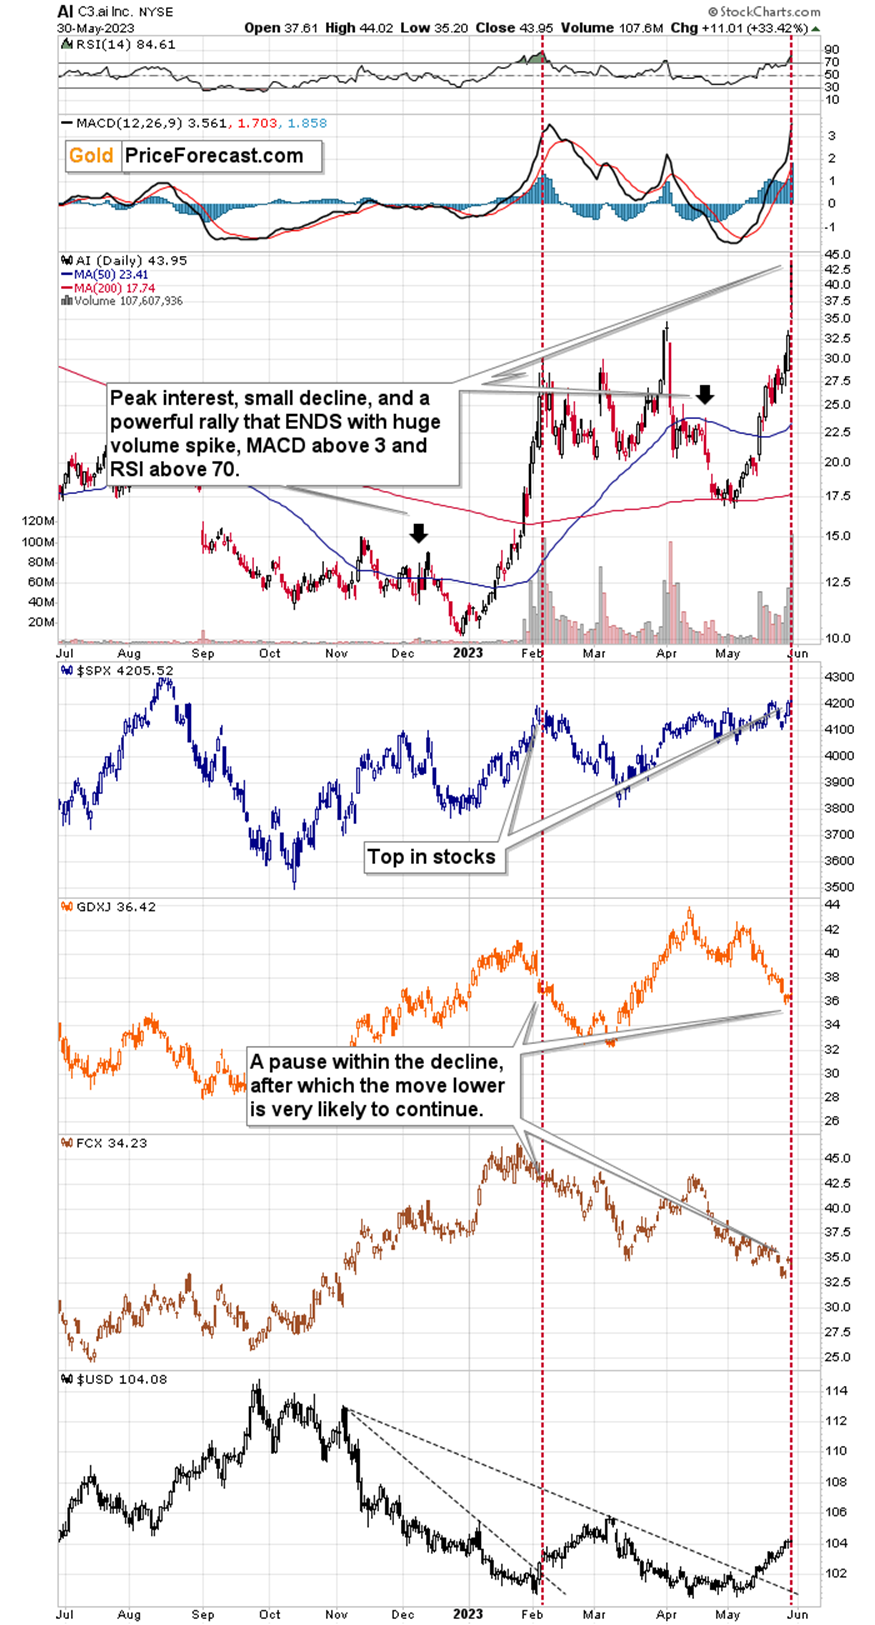
The above chart features the AI stock price, which, primarily due to the symbol that it has on NYSE, we’re going to use as a proxy for the sector. The company (quoting their website) is an enterprise AI software provider for building enterprise-scale AI applications and accelerating digital transformation.
The value of the shares of this company has been declining in the previous years, but that definitely wasn’t the case this year!
What’s particularly interesting is how rallies followed peak interest.
I marked the Google-based peaks in interest with black arrows in the main part of the above chart.
What followed in both cases is that the price initially declined a bit, but then it picked up and soared with a vengeance. It took several weeks in both cases, and in both of them, the rally took an exponential form.
That powerful and unsustainable rally ended last time when the following happened:
-
The MACD indicator moved above 3.
-
The RSI indicator moved above 70.
-
The AI price itself rallied on huge daily volume.
That’s also exactly what we saw yesterday!
Yes, I know, one swallow doesn’t make a summer, and that’s just one similar situation from the past, BUT it’s one situation from the past that has remarkable number of similarities. It’s not just “one thing” like the RSI. It’s the whole package.
Since AI seems to be the driving force of the recent rally in stocks (just look at the headlines on any mainstream financial website for proof), the is likely an indication that stocks have just topped or are very close to their turning point.
That’s exactly what happened in early February when the previous top in AI formed. And it has some specific trading tips for gold stocks, and the stock market in general.
Implications for stocks and miners
Thanks to the vertical dashed lines, you can easily see what happened during those two specific times to stocks, junior miners (GDXJ), and FCX, which I’m using as a proxy for copper and gold (and which is interesting on its own due to how hard it fell in 2008, and due to the fact that we currently have a profitable position in it).
At that moment, in early February, stocks topped, and it was a pause in case of the GDXJ and FCX.
The aftermath was bearish in cases of all: AI, S&P 500, GDXJ, and FCX. It was particularly bearish for silver prices, too.
That was also the time, when the USD Index (which you can see at the bottom of the above chart) consolidated a bit and then moved higher once again. Interestingly, back then, the USD Index was after a breakout above the first of the declining support lines, and now it’s after its second breakout. This time, the importance of the breakout is much greater, so it’s normal that we saw a bigger rally thereafter.
So, what does all this AI-hype tell us?
That it’s probably over in the short- and/or medium term. I continue to see great potential in the AI sector in the long run, though.
And that the stocks are likely topping here, which, in turn, is likely to lead to lower mining stock values.
This also indicates that the miners might move lower and that betting on their rally in the very near term based on an oversold RSI is not as much of a “sure bet” that many think right now.
Back in 2008, after the pre-slide rally, mining stocks “seemed” like a good buy as well, and that didn’t end well at all.
Want free follow-ups to the above article and details not available to 99%+ investors? Sign up to our free newsletter today!
Want free follow-ups to the above article and details not available to 99%+ investors? Sign up to our free newsletter today!
Author

Przemyslaw Radomski, CFA
Sunshine Profits
Przemyslaw Radomski, CFA (PR) is a precious metals investor and analyst who takes advantage of the emotionality on the markets, and invites you to do the same. His company, Sunshine Profits, publishes analytical software that any


