![]() Brandon Wendell, CMT
Brandon Wendell, CMT
Brandon Wendell
There is something that can increase your chances for success in the markets that novice traders and investors tend to ignore. This is the seasonality of the markets they trade. Professionals are aware of the seasonality of securities and use that knowledge to select the right securities and even to time their entries and exits to maximize profits and minimize risk.
You may have heard of the term, “The Santa Clause Rally”, or the phrase, “Sell in May and go away!” There is some truth to these sayings. They are referring to the seasonal movements in price that occur at regular time periods during the year.
Most novice traders and investors look myopically at the security they wish to trade. They may look at the financial data from the company itself, or the chart of the security they are trading. However, they tend to ignore the outside influences that can affect their trades such as seasonal patterns and related securities.
There are seasons for all securities:
-
Spring – Prices are starting their bullish rise.
-
Summer – The bull market and then the start of a slowdown and sideways consolidation
-
Autumn – Prices begin to fall
-
Winter – The full bear market before the slowing and sideways consolidation
When you are looking for the seasonal pattern for a security, you are want to at the average price movement every year for at least 10 years. Anything less would not be accurate. Some web based seasonal services even average the price movement for up to 30 years.
 3
3
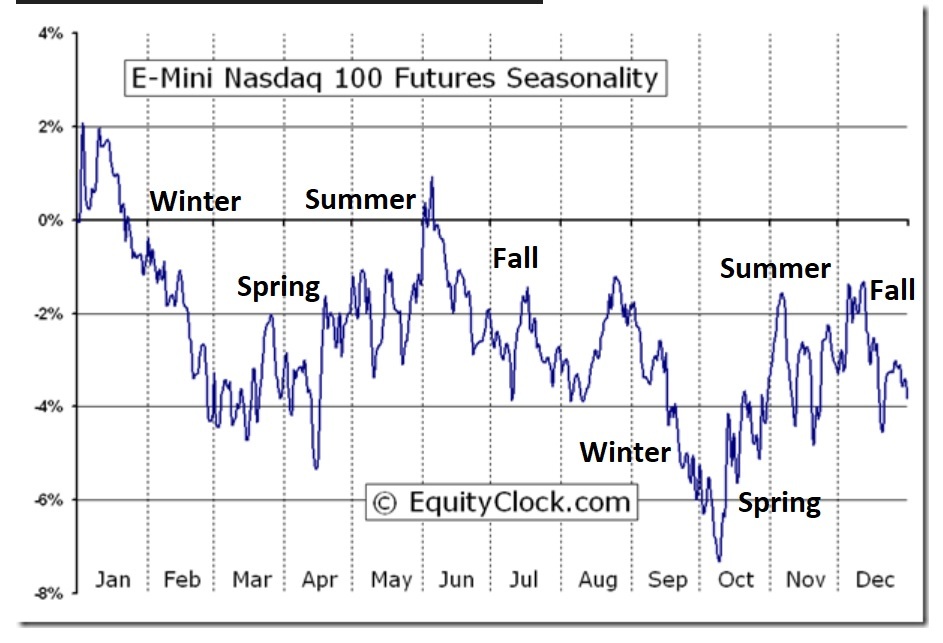
The chart above shows the seasonal pattern for the Nasdaq 100 index. The seasonal names, (spring, summer, autumn, winter), do not correlate to the calendar seasons. Rather, they describe the price action of the security. The spring for oil prices will occur in a different month than spring for the S&P 500. Oil will see prices rise when demand is strongest and drop when it is weakest.
Knowing seasonal patterns of the markets and securities we trade offers longer-term traders and investors a distinct advantage. When our weekly or monthly charts are approaching a supply or demand zone at the same time the season for that security is changing, we can increase our odds for successfully identifying the trend change. For example, if the season is contrary to the zones (approaching a supply zone in the spring season) we may break the zone instead of reversing.
The drawback to using seasonality is that there may be a cost to obtain the information. Several services are available online and offer charts to identify the seasonal patterns for indexes and commodities for a fee. If you can use this data to increase your profitability in the markets, the cost can be well worth it.
The seasonality should only be used to compliment Online Trading Academy’s core strategy. Trying to invest solely on seasonality could lead to losses. You can improve your trading and investing success by combining this seasonal analysis to the application of core strategy on your long-term charts. To learn what analysis is required, enroll in a course at your local Online Trading Academy center today.
Neither Freedom Management Partners nor any of its personnel are registered broker-dealers or investment advisers. I will mention that I consider certain securities or positions to be good candidates for the types of strategies we are discussing or illustrating. Because I consider the securities or positions appropriate to the discussion or for illustration purposes does not mean that I am telling you to trade the strategies or securities. Keep in mind that we are not providing you with recommendations or personalized advice about your trading activities. The information we are providing is not tailored to any individual. Any mention of a particular security is not a recommendation to buy, sell, or hold that or any other security or a suggestion that it is suitable for any specific person. Keep in mind that all trading involves a risk of loss, and this will always be the situation, regardless of whether we are discussing strategies that are intended to limit risk. Also, Freedom Management Partners’ personnel are not subject to trading restrictions. I and others at Freedom Management Partners could have a position in a security or initiate a position in a security at any time.
Editors’ Picks

EUR/USD flirts with daily highs, retargets 1.1900
EUR/USD regains upside traction, returning to the 1.1880 zone and refocusing its attention to the key 1.1900 barrier. The pair’s slight gains comes against the backdrop of a humble decline in the US Dollar as investors continue to assess the latest US CPI readings and the potential Fed’s rate path.

GBP/USD remains well bid around 1.3650
GBP/USD maintains its upside momentum in place, hovering around daily highs near 1.3650 and setting aside part of the recent three-day drop. Cable’s improved sentiment comes on the back of the Greenback’s irresolute price action, while recent hawkish comments from the BoE’s Pill also collaborate with the uptick.

USD/JPY edges up above 153.50 with all eyes on US CPI figures
USD/JPY appreciates above 153.00 but remains on track for a 2.4% weekly loss. Trading volumes remain subdued on Friday, ahead of the IS CPI release. The Yen remains supported by hopes of a stable government and calls for further BoJ tightening.
Editors’ Picks

EUR/USD: Yes, the US economy is resilient – No, that won’t save the US Dollar Premium
Some impressive US data should have resulted in a much stronger USD. Well, it didn’t happen. The EUR/USD pair closed a third consecutive week little changed, a handful of pips above the 1.1800 mark.

Gold: Metals remain vulnerable to broad market mood Premium
Gold (XAU/USD) started the week on a bullish note and climbed above $5,000 before declining sharply and erasing its weekly gains on Thursday, only to recover heading into the weekend.

GBP/USD: Pound Sterling remains below 1.3700 ahead of UK inflation test Premium
The Pound Sterling (GBP) failed to resist at higher levels against the US Dollar (USD), but buyers held their ground amid a US data-busy blockbuster week.

Bitcoin: BTC bears aren’t done yet
Bitcoin (BTC) price slips below $67,000 at the time of writing on Friday, remaining under pressure and extending losses of nearly 5% so far this week.

US Dollar: Big in Japan Premium
The US Dollar (USD) resumed its yearly downtrend this week, slipping back to two-week troughs just to bounce back a tad in the second half of the week.
RECOMMENDED LESSONS
Making money in forex is easy if you know how the bankers trade!
I’m often mystified in my educational forex articles why so many traders struggle to make consistent money out of forex trading. The answer has more to do with what they don’t know than what they do know. After working in investment banks for 20 years many of which were as a Chief trader its second knowledge how to extract cash out of the market.
5 Forex News Events You Need To Know
In the fast moving world of currency markets where huge moves can seemingly come from nowhere, it is extremely important for new traders to learn about the various economic indicators and forex news events and releases that shape the markets. Indeed, quickly getting a handle on which data to look out for, what it means, and how to trade it can see new traders quickly become far more profitable and sets up the road to long term success.
Top 10 Chart Patterns Every Trader Should Know
Chart patterns are one of the most effective trading tools for a trader. They are pure price-action, and form on the basis of underlying buying and selling pressure. Chart patterns have a proven track-record, and traders use them to identify continuation or reversal signals, to open positions and identify price targets.
7 Ways to Avoid Forex Scams
The forex industry is recently seeing more and more scams. Here are 7 ways to avoid losing your money in such scams: Forex scams are becoming frequent. Michael Greenberg reports on luxurious expenses, including a submarine bought from the money taken from forex traders. Here’s another report of a forex fraud. So, how can we avoid falling in such forex scams?
What Are the 10 Fatal Mistakes Traders Make
Trading is exciting. Trading is hard. Trading is extremely hard. Some say that it takes more than 10,000 hours to master. Others believe that trading is the way to quick riches. They might be both wrong. What is important to know that no matter how experienced you are, mistakes will be part of the trading process.
The challenge: Timing the market and trader psychology
Successful trading often comes down to timing – entering and exiting trades at the right moments. Yet timing the market is notoriously difficult, largely because human psychology can derail even the best plans. Two powerful emotions in particular – fear and greed – tend to drive trading decisions off course.