Market Recap


Market Recap

%

Close Price

EURTRY

0.41%

4.56

EURCAD

0.22%

1.5048

EURUSD

0.16%

1.1790

S&P500 Index

-0.26%

2,578.85

EURJPY

-0.67%

132.17

AUDJPY

-1.13%

84.80

Prices as of previous day instrument closing.


  • Stocks in Europe were back in red on Friday to close the week. Utilities were the biggest losers and outweighed strength in media giants. Strength in the euro also helped stocks slide. Euro Stoxx 50 and FTSEMIB down 0.5%, while IBEX 35 slipped 0.78%.  Negative session also for US Indices. DJIA lost 100.12 points at 23,358.24 while S&P500 slid 6.79 points to 2,578.85.

  • In the FX market the Japanese Yen rallied. USDJPY slid to 112.10, down 0.84% while CADJPY slid 0.87% to 87.85.  Both Kiwi and Aussie dollar dropped against the greenback (thus the loss against JPY was even more severe). NZDUSD slid 0.61% to 0.6809 and AUDUSD dropped 0.31% to 0.7564.

  • Crude Oil WTI rallied +2.56% to 56.55 $/barrel while Brent rose to 62.72 $/barrel, up 2.22%; both contracts expire on January.  Gold rose to 1,292 $/oz, up +1.08% and XAGUSD outperformed the shiny metal and closed at 17.31 $/oz, up +1.28%.


Charts of the day: 

NIKKEI INDEX (daily timeframe)

Nikkei

The gauge started to make lower highs and lower lows since the 20 year peak 23,382.15 made on the 9th of November. Only a breakout of the bearish dynamic resistance it may trigger another bullish leg. In case the retracement should continue the most relevant support should be near 21,000-20,860.

Economic Calendar

Monday November 20, 2017  CET Time

Forecast

Previous

n/a

EUR

German BUBA Monthly Report 


13:15

EUR

ECB’s Lautenschlager Speech


15:00

EUR

ECB President Draghi’Speech


15:15

EUR

ECB Vice President Vitor Costancio Speech


17:00

EUR

ECB President Draghi’Speech


17:30

USD

6-Month Bill Auction


1.36%

The week starts off slowly without any noteworthy releases on Monday. However, ECB President Draghi is speaking twice today with a potential market-moving speech at 15:00 CET. He will testify at the ECON hearing in Brussels to comment on economic and monetary developments. This is then followed by a discussion covering the following topic: “Design and sequencing of exit from nonstandard monetary policy measures: What should the ECB “new normal” look like?". In the second speech, at 17:00 CET, Draghi will deliver an introductory statement in his capacity as ESRB Chair at the ECON hearing.


Technical Analysis

EURUSD  (Daily timeframe)

EURUSD

EURUSD found resistance against its 55MA. Is possible a pullback in area 1.1670 and then it may test its recent low at 1.1553. Beneath this level selling pressure could increase. Above last week high 1.1865 EURUSD could rise to 1.20 and above this level it could test 1.2092.

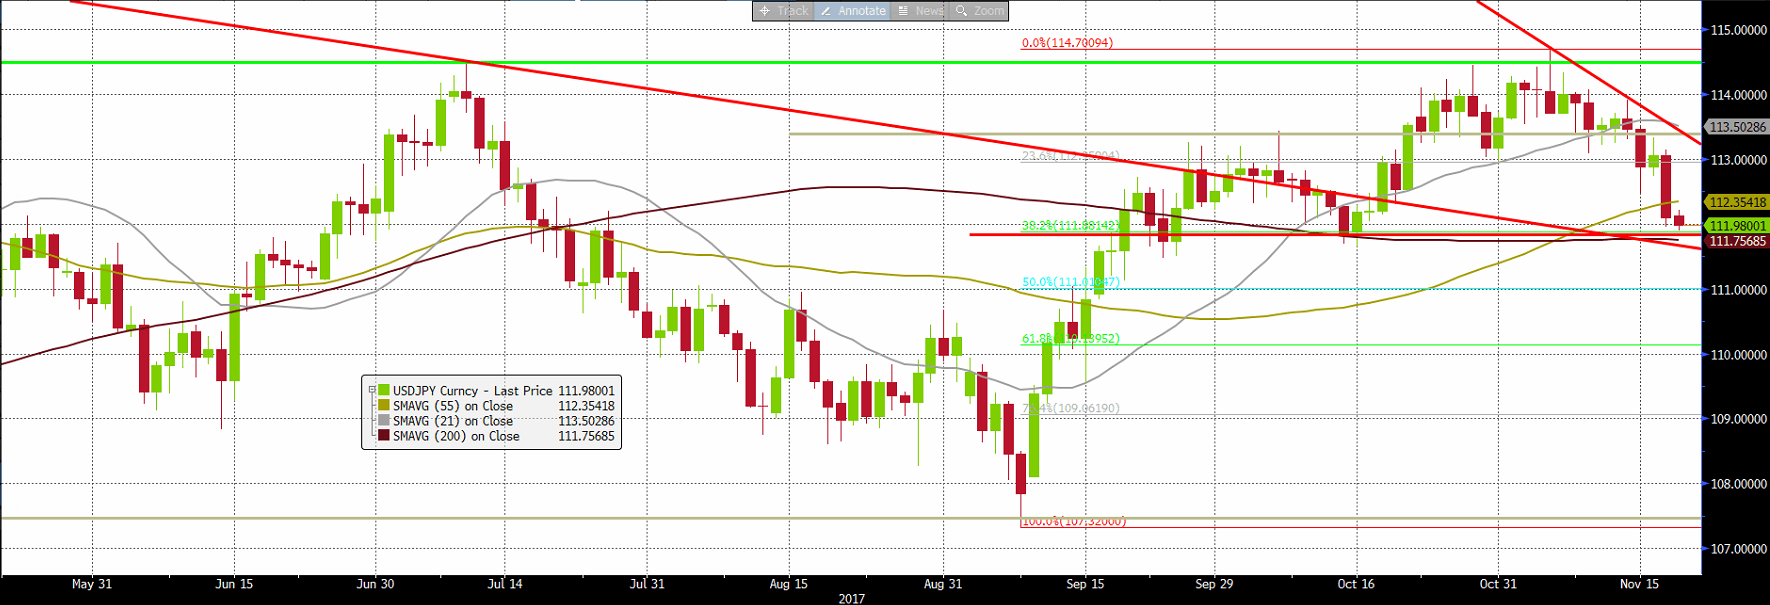
USDJPY  (Daily timeframe)

USDJPY

USDJPY found support at 111.80, the 38.2% Fibonacci retracement of the bullish wave started in September that ended this month. Beneath 111.80 the pair could slide to 110 and then test 107.32. Above 113.5 USDJPY could rise to 114.7 and then test area 117.

FTSEMIB (Daily timeframe)

FTSE

Weakness on the FTSEMIB resumed on Friday, with the index recording its lowest close since mid-September. It now sits on the key horizontal support from August highs. A break lower than 22158, last Wednesday’s high, should trigger a deeper sell-off to 21500 areas. Only a break above 22297, the gap between Tuesday’s close and Wednesday’s open, would relieve the bearish pressure at this point.

BUND (Daily timeframe)

BUND

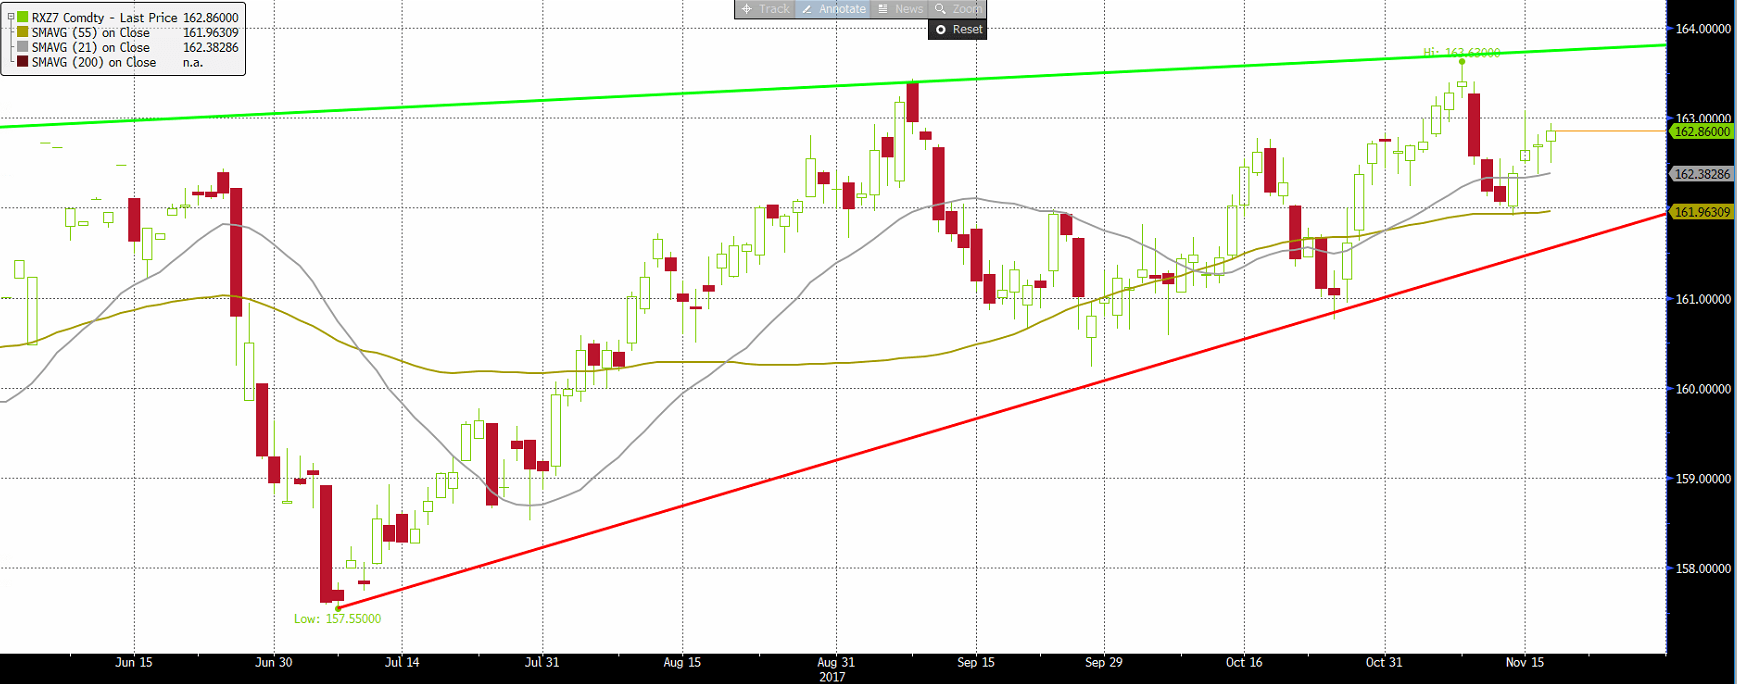
The price of the Bund (December) future is in the middle of a rising wedge, as it continues to make higher lows and stretch higher. From here, the price is expected to test this month’s high at 163.63. 162 should keep the price supported.

EURO STOXX50 (Daily timeframe)

EURO

EURO STOXX 50 failed to break the previous day’s high and retreated to close below 3550. The index is testing the bottom of a rising trendline and just off the 50% Fibonacci retracement of the August low to November high move. A break below 3536 and last week’s low at 3519 would pave the way for a test of 3500. A move above 3578 is required to relieve the equity index from its bearish pressure in the near-term.


The information provided in this document is marketing communication and does not contain investment advice. ALB Forex Trading Ltd. will not accept any liability for any loss or damage which may arise from the use of such information. There is a high level of risk involved with trading leveraged products such as forex and CFDs. You should not risk more than you can afford to lose. You should not trade unless you fully understand the true extent of your exposure to the risk of loss. When trading, you must always take into consideration your level of experience. It is the responsibility of the Client to ensure that the Client can accept the Services and/or enter into the Transactions in the country in which the Client is resident. If the risks involved seem unclear to you, please seek independent advice. ALB Forex Trading Ltd. is authorised and regulated by the Malta Financial Service Authority (License No: IS/79767). Our registered address is 48, Casa Roma, Sir Augustus Bartolo Street, XBX 1099. Ta`Xbiex, Malta. Tel: +356 2371 6000.

Editors’ Picks

EUR/USD flirts with daily highs, retargets 1.1900

EUR/USD flirts with daily highs, retargets 1.1900

EUR/USD regains upside traction, returning to the 1.1880 zone and refocusing its attention to the key 1.1900 barrier. The pair’s slight gains comes against the backdrop of a humble decline in the US Dollar as investors continue to assess the latest US CPI readings and the potential Fed’s rate path.

GBP/USD remains well bid around 1.3650

GBP/USD remains well bid around 1.3650

GBP/USD maintains its upside momentum in place, hovering around daily highs near 1.3650 and setting aside part of the recent three-day drop. Cable’s improved sentiment comes on the back of the Greenback’s  irresolute price action, while recent hawkish comments from the BoE’s Pill also collaborate with the uptick.

USD/JPY edges up above 153.50 with all eyes on US CPI figures

USD/JPY edges up above 153.50 with all eyes on US CPI figures

USD/JPY appreciates above 153.00 but remains on track for a 2.4% weekly loss. Trading volumes remain subdued on Friday, ahead of the IS CPI release. The Yen remains supported by hopes of a stable government and calls for further BoJ tightening.


Editors’ Picks

EUR/USD: Yes, the US economy is resilient – No, that won’t save the US Dollar

EUR/USD: Yes, the US economy is resilient – No, that won’t save the US Dollar Premium

Some impressive US data should have resulted in a much stronger USD. Well, it didn’t happen. The EUR/USD pair closed a third consecutive week little changed, a handful of pips above the 1.1800 mark. 

Gold: Metals remain vulnerable to broad market mood

Gold: Metals remain vulnerable to broad market mood Premium

Gold (XAU/USD) started the week on a bullish note and climbed above $5,000 before declining sharply and erasing its weekly gains on Thursday, only to recover heading into the weekend. 

GBP/USD: Pound Sterling remains below 1.3700 ahead of UK inflation test

GBP/USD: Pound Sterling remains below 1.3700 ahead of UK inflation test Premium

The Pound Sterling (GBP) failed to resist at higher levels against the US Dollar (USD), but buyers held their ground amid a US data-busy blockbuster week.

Bitcoin: BTC bears aren’t done yet

Bitcoin: BTC bears aren’t done yet

Bitcoin (BTC) price slips below $67,000 at the time of writing on Friday, remaining under pressure and extending losses of nearly 5% so far this week.

US Dollar: Big in Japan

US Dollar: Big in Japan Premium

The US Dollar (USD) resumed its yearly downtrend this week, slipping back to two-week troughs just to bounce back a tad in the second half of the week.

RECOMMENDED LESSONS

5 Forex News Events You Need To Know

In the fast moving world of currency markets where huge moves can seemingly come from nowhere, it is extremely important for new traders to learn about the various economic indicators and forex news events and releases that shape the markets. Indeed, quickly getting a handle on which data to look out for, what it means, and how to trade it can see new traders quickly become far more profitable and sets up the road to long term success.

Top 10 Chart Patterns Every Trader Should Know

Chart patterns are one of the most effective trading tools for a trader. They are pure price-action, and form on the basis of underlying buying and selling pressure. Chart patterns have a proven track-record, and traders use them to identify continuation or reversal signals, to open positions and identify price targets.

7 Ways to Avoid Forex Scams

The forex industry is recently seeing more and more scams. Here are 7 ways to avoid losing your money in such scams: Forex scams are becoming frequent. Michael Greenberg reports on luxurious expenses, including a submarine bought from the money taken from forex traders. Here’s another report of a forex fraud. So, how can we avoid falling in such forex scams?

What Are the 10 Fatal Mistakes Traders Make

Trading is exciting. Trading is hard. Trading is extremely hard. Some say that it takes more than 10,000 hours to master. Others believe that trading is the way to quick riches. They might be both wrong. What is important to know that no matter how experienced you are, mistakes will be part of the trading process.

Strategy

Money Management

Psychology

Best Brokers of 2025