What Does the VIX Mean to Option Traders?

What Is the VIX?
The Chicago Board Options Exchange’s Volatility Index (known as the VIX) is an indicator that tells option traders whether options are currently cheap or expensive, relative to their normal values. This is an indication of whether it is a better time to be a buyer of options or a seller.
The VIX is calculated in real time based on the prices at which options on one particular underlying instrument, namely the Standard & Poor’s 500 Index, are trading.
A mathematical formula, derived from the Black Scholes option pricing model, translates the price at which an option is trading (which reflects the price at which people are willing to buy the option), into those buyers’ expected rate of change of the underlying asset. This expected rate of change is called the underlying asset’s implied volatility or IV. When the underlying asset we’re measuring is the S&P 500 index, then its IV has a special name – the VIX.
What Does Implied Volatility Tell Traders?
Implied volatility is expressed as an annual percentage of expected price change. A VIX of 20 means that S&P option buyers, on average, believe that the S&P index will move in the future at the annual rate of 20% per year. A VIX of 10 would mean that, collectively, they believe that it will move at the rate of only 10% per year. In the last 25 years, the VIX has ranged from a low of 9.5% to a high of over 90%; and spent most of that time in the range of 12% to 25%.
When option buyers believe that the S&P 500 is going to make a large move in the near future, they will be willing to pay high prices for its options. In that case we would see a high VIX reading, meaning S&P options are expensive. If they don’t think it will move much, then the VIX will be lower, meaning that options are cheap.
By the way, the direction people expect the index to move doesn’t matter – only the expected speed of that movement. If the index is expected to move fast, both puts and calls will be expensive (high VIX). When it is expected to move slowly, then both puts and calls will be cheap. When traders’ opinions change, then the VIX changes, reflecting the fact that options have become relatively cheaper or more expensive.
Option Trading and the VIX
The VIX itself is volatile and can easily double or be cut in half over the course of a month. Its movement reflects the changes in option buyers’ expectations, and that change can sometimes overcome the change in an option’s price that results from the actual movement in the index. In other words, in certain cases, it can happen that the index goes up but the price of a call goes down. An option buyer could be right about the direction of the underlying asset, for example, the S&P goes up; and have made a bullish option trade, buying a call; and still lose money if they are wrong about implied volatility (IV) causing the call price to go down.
So, whenever an option trader makes an option trade, he is simultaneously making two trades – one based on underlying price direction and one based on implied volatility.
A bullish trader would do a bullish trade – buying calls or selling puts.
A bearish trader would do a bearish trade – selling calls or buying puts.
Overlaid on this is the trader’s opinion on whether IV will go up or down. This is separate and apart from his opinion on the price of the underlying.
If he believes IV is most likely to go up, then he should be a buyer of options – calls if bullish or puts if bearish. If IV does go up, it will push up on the price of both calls and puts. This effect will be in addition to the effect of the actual price movement of the underlying.
If the trader believes that IV will go down, then he should be a short seller of options – calls if bearish on the underlying or puts if bullish. If he is correct and IV drops, that will push downward on the price of the puts or calls that he has sold short, making money faster than the effect of underlying price movement alone.
The S&P 500 index is a major barometer of the stock market. This is true both of its level (when the S&P is at a high, then many of the 500 stocks that make it up must be at highs too), and of its IV. When the VIX (the S&P’s IV) is high, then the IV of many of its constituent stocks is also high and options are expensive in general.
So, where are we now?
On November 27, the VIX stood at 11.75, as shown here:
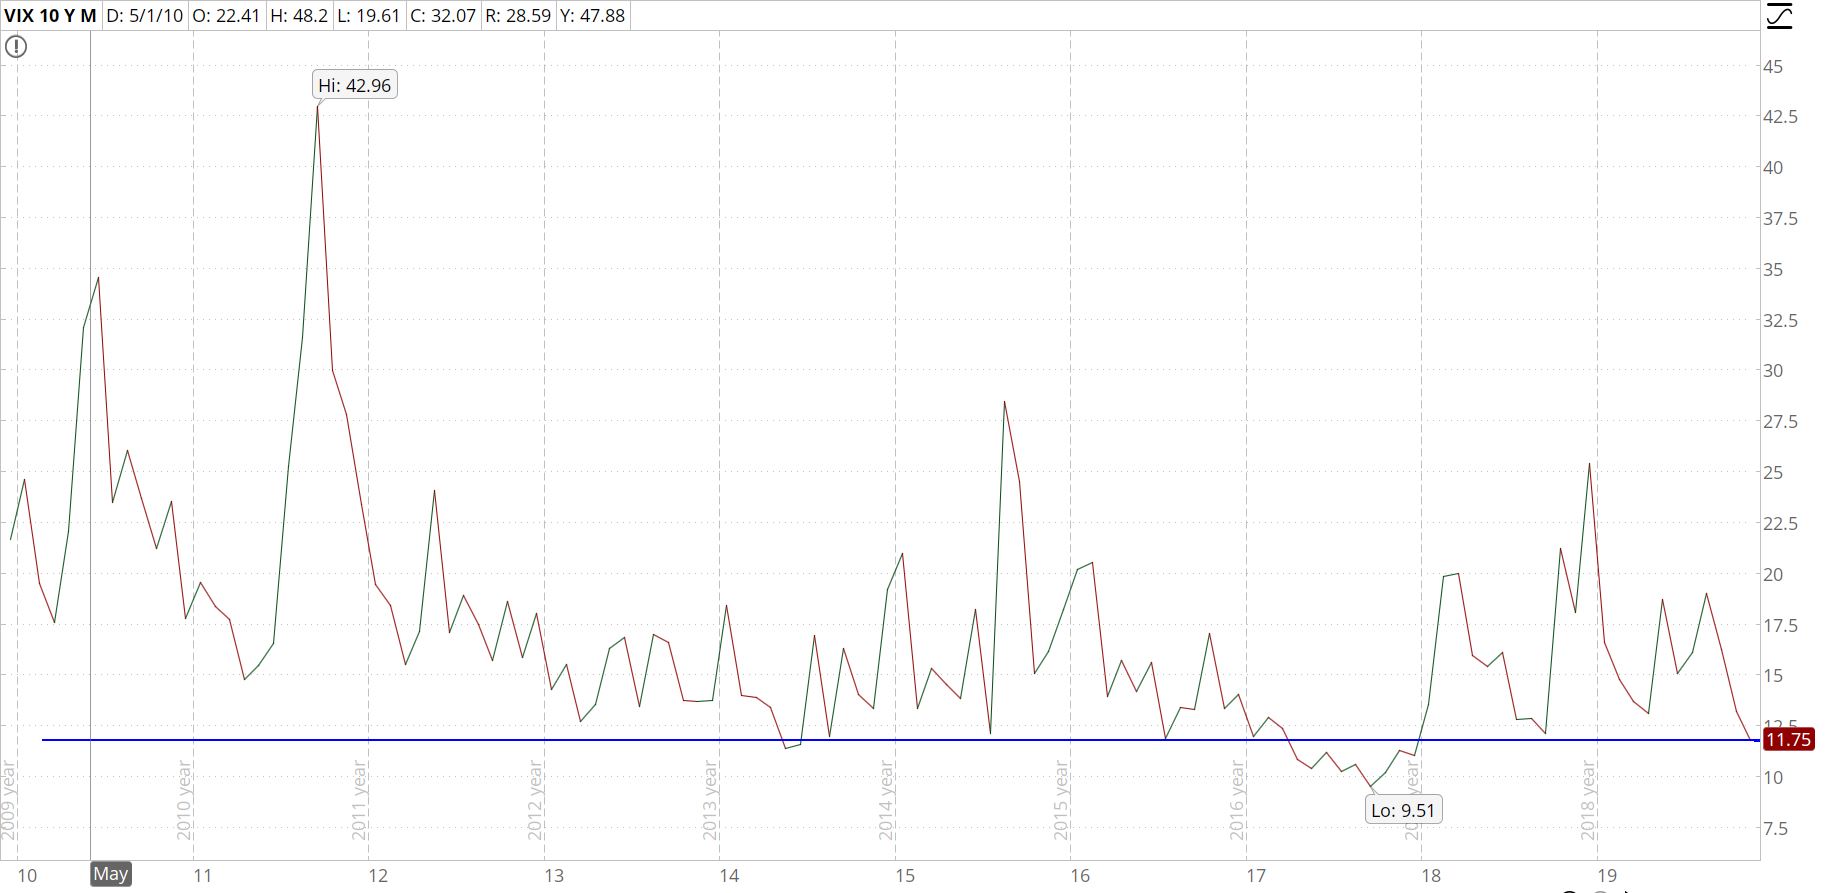
This was lower than the VIX had been for almost all of the last ten years. It meant that options were relatively very cheap, and much more likely to get more expensive (i.e.to go back to a more normal level) than to get even cheaper. In short, it was a good time to buy options.
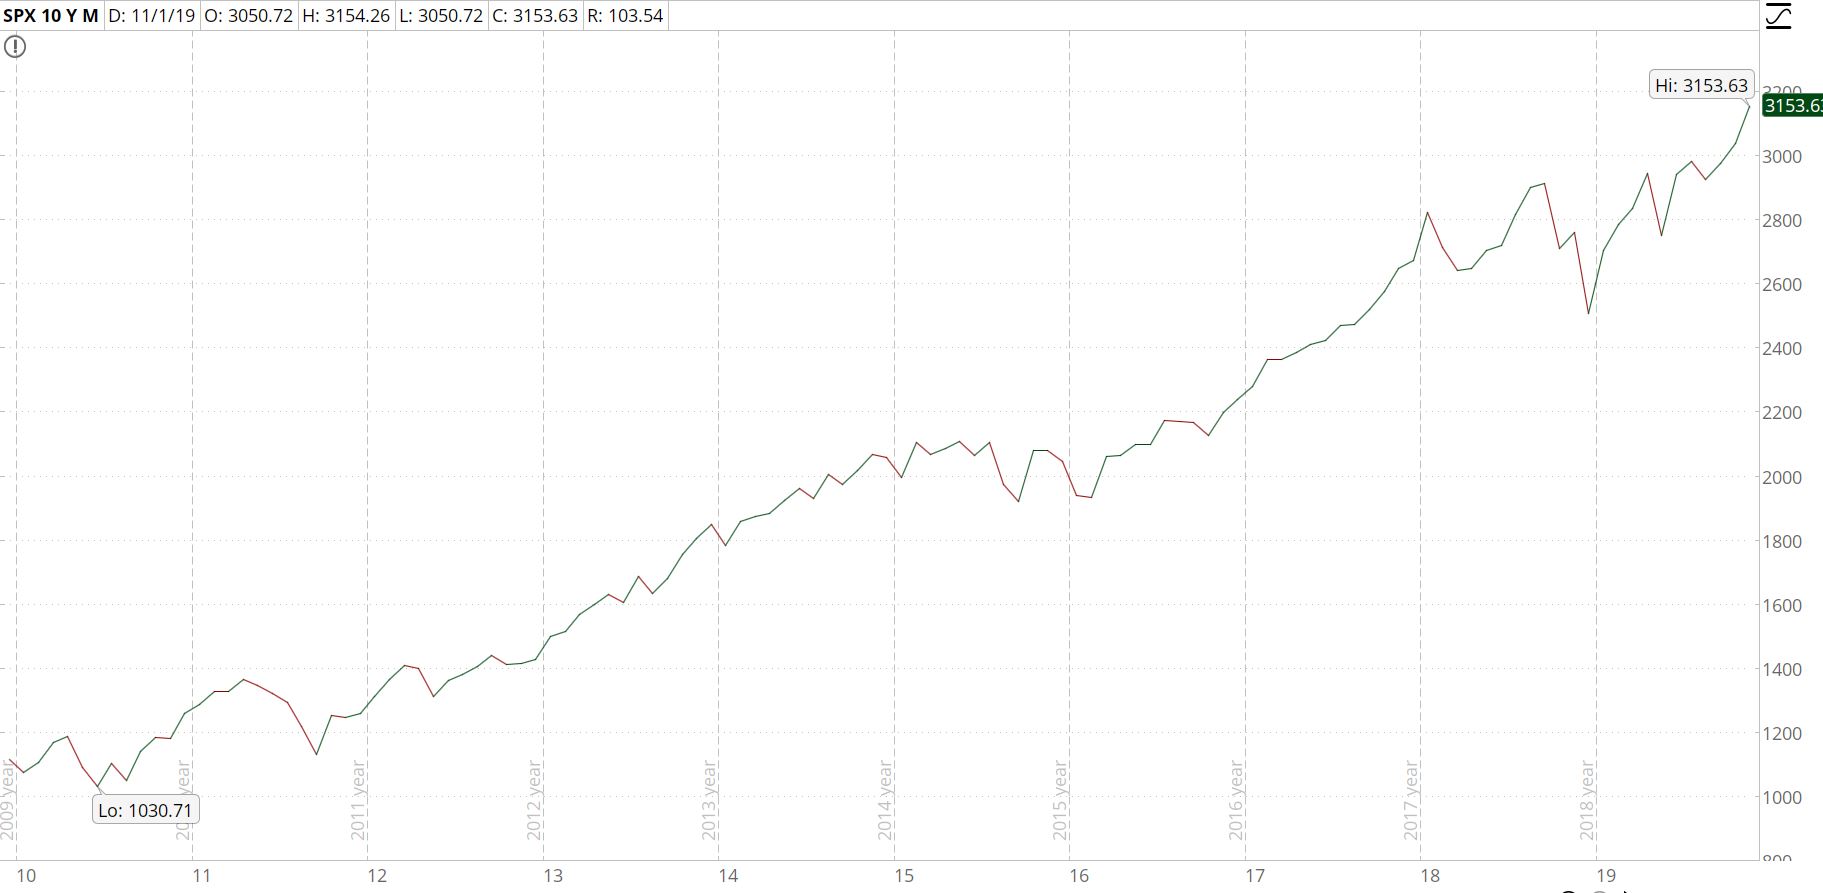
Meanwhile, the S&P 500 index itself stood at an all-time high of 3,153.
For anyone with a stock portfolio, insurance in the form of puts on the S&P was very cheap. Anyone who wanted to lock in the majority of their profits could do so for a very low cost.
The low VIX also meant that, for all option traders it was a better time to be a buyer of options than a seller – in option lingo, a time to concentrate on debit trades instead of credit trades.
The implied volatility of any underlying asset whose options we want to trade is a critical factor when deciding what option strategy to use. And the VIX indicates which way the volatility winds are blowing.
For more on option trading strategies and how they can benefit traders in both short-term market moves and in protecting a long-term portfolio, contact your local center about our Options program.
Author

Russ Allen
Online Trading Academy
Russ decided to make his lifelong passion, trading, his full-time occupation in 2003. With extensive experience in trading, education, and business in general, he sought the highest-quality trading education he could find.


