Well Above Average

For years, brokers and mutual fund managers have been telling investors to dollar cost average. This is a strategy where the investor consistently adds equal amounts of money to their investment on a regular basis. Due to market fluctuations, the investor should be able to buy more shares when the price is down and less shares when the price rises. The theory behind this is that after a period of time the investor would have a better cost basis for their investments than if they had invested a lump sum all at once. Many brokers believe that an individual cannot time the market and is better off averaging their costs.
While this may work in theory, in real life traders know this is not the case. Brokers caught onto Dollar cost averaging as a way to increase their commissions and appease clients who may be facing losses. If this strategy was applied to a stock in the beginning of 2008, 2000 or any market bubble, it would have had disastrous results.
Since traders and investors can make a greater profit by timing the markets, what would happen if we added to our winning trades? In the courses at Online Trading Academy, we constantly talk about letting your profits run, and in the Extended Learning Tracks we teach how to manage trades in progress. If you are in a trade that is working out, you know you were right on the direction. Why not add to your winnings at a reasonable place to capture more profits in the position? Bigger winners will allow you to have a larger cushion to cover any small losses in your trading.
So the question is: where would be the logical place to add to your winning positions? You do not want to arbitrarily add just because your position is gaining. Many times, we may end up adding to the winner just after a fast move in our favor, only to see the prices correct and the new addition to our position start losing.
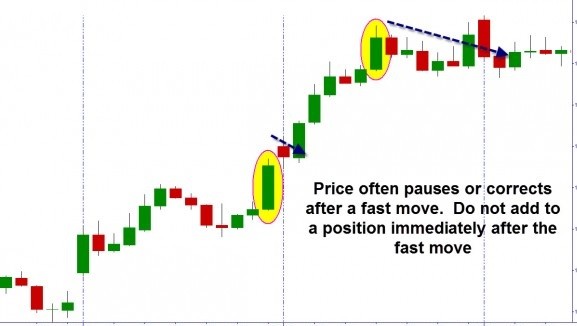
Obviously, we need a logical, low risk opportunity to add to our winners. This is like what we want when we enter the position initially. There are several setups that offer low risk, high probability and high profit potential that are taught in the Professional Trader course. These setups are perfect for adding to winning positions. We can add to our winners on retracements to zones and/or patterns called Momentum Breakouts (MBO).
There are several momentum breakout patterns that we identify, but don’t have the space to describe them in detail here. However, you are looking for a certain pattern that still allows you to buy near a demand zone and sell near a supply zone.
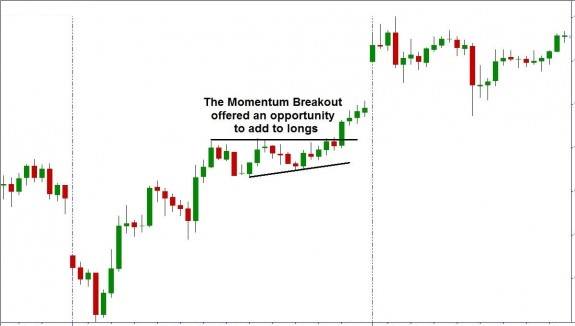
The momentum breakout trading opportunities are also perfect for intraday trading on days where there is a large gap and go in a stock. Many traders get frustrated when they see a stock screaming to new highs or dropping fast after a gap down without them on board. Learning the momentum breakout strategies will give you an opportunity to trade these situations with lower risk.
The market turns can be timed. At Online Trading Academy, we teach our students proper market timing techniques through rule based trading. What we do not teach is an outdated strategy that can put student’s capital at great risk. Until next time, trade safe and trade well!
Author

Brandon Wendell, CMT
Brandon Wendell
Brandon started off in the industry as a retail stockbroker working the phones. With a thirst to learn more about market mechanics, he moved into back-office operations handling order flow as an Agency Desk Operator for a major brokerage.
















