Let it be stated upfront that there is no perfect way to analyze and forecast financial markets. No crystal balls.

Yet, let's be just as quick to add that in Elliott Wave International's review of market analysis methods, none approach the utility of the Elliott wave model.

The reason for the Elliott wave model's usefulness is easily explained: Elliott waves are reflections of the repetitive patterns of investor psychology, which is the real driver of prices, not news or events.

And, what could be more useful to an investor than a method which helps to identify a financial market's trend -- especially before it gets underway? Well, mastering the Elliott wave model helps you to do just that.

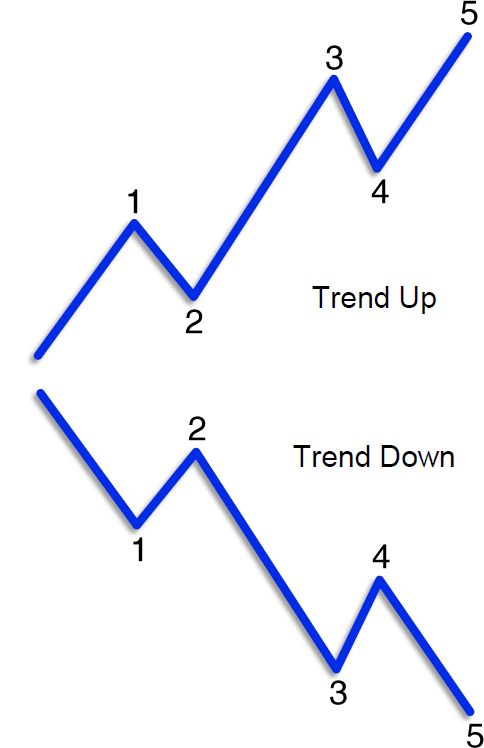
The Wall Street classic book, Elliott Wave Principle: Key to Market Behavior by Frost & Prechter, says:

...action in the same direction as the one larger trend develops in five waves.

Here are illustrations:

Trend Up Down

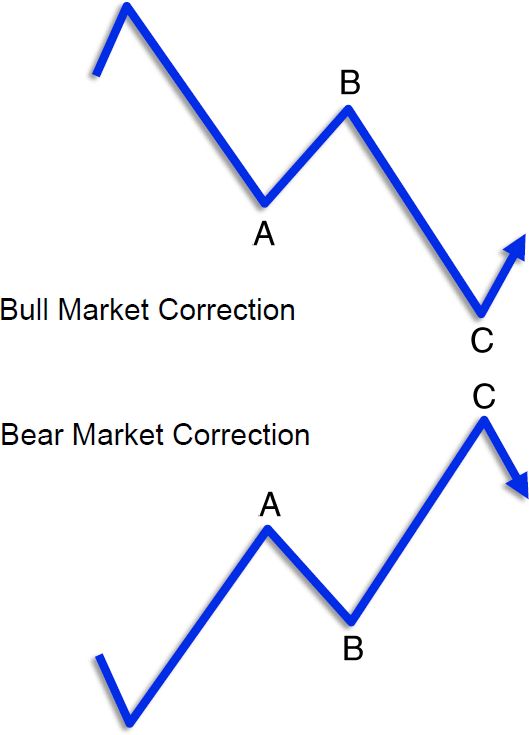
Let's now learn how the Elliott wave model identifies countertrend moves within the main trend by returning to Elliiott Wave Principle and additional illustrations:

... reaction against the one larger trend develops in three waves.

Countertrend

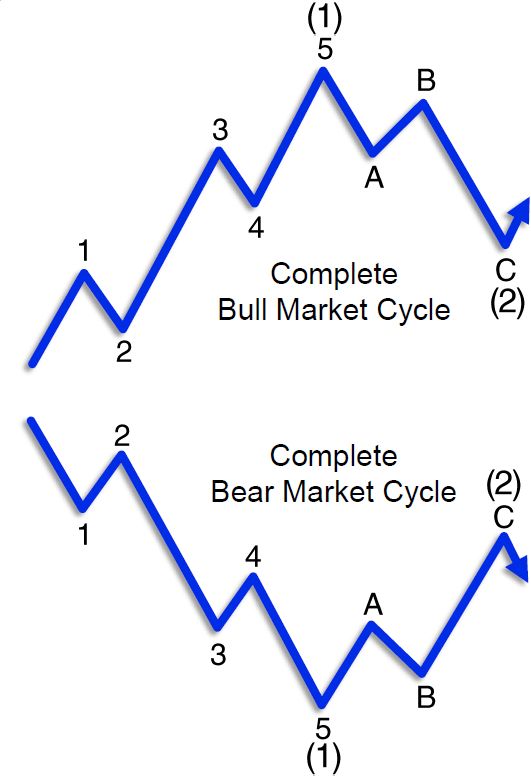
Lastly, let's learn how Elliott wave analysis signals the resumption of the main trend.

Elliott Wave International analyst Jeffrey Kennedy says:

A complete Elliott wave cycle consists of eight waves. Upon its completion, a similar cycle ensues....

Again, here are illustrations of the point:

Eight Waves

The reason that a market's basic form is five waves followed by three waves is that this is the most efficient method of achieving both fluctuation and progress in linear movement.

Think of it as a variation of nature's "two steps forward, one step back" model of achieving progress.

After all, humans are a part of the natural world, so it only follows that the financial markets, a product of human interaction, would carry the same imprint.

As you might imagine, there are many more details in applying the Elliott Wave Principle to financial markets, and it took an entire book to lay them all out.

The purpose of this article is to simply show you that the price patterns of financial markets unfold according to a repetitive, predictable structure. Familiarity with that structure can help you determine what's next.

Jump on once-in-a-lifetime opportunities and avoid dangerous pitfalls that no one else sees coming. We can help you prepare for opportunities and side step risks that will surprise most investors. You can get deeper insights in Elliott Wave International's new free report: 5 "Tells" that the Markets Are About to Reverse. The insights that you'll gain are especially applicable to the price patterns of key financial markets, including the stock market, now.


Get more financial insights like these -- 100% free.


Elliott Wave International does not provide investment advice. All rights reserved.

Editors’ Picks

EUR/USD flirts with daily highs, retargets 1.1900

EUR/USD flirts with daily highs, retargets 1.1900

EUR/USD regains upside traction, returning to the 1.1880 zone and refocusing its attention to the key 1.1900 barrier. The pair’s slight gains comes against the backdrop of a humble decline in the US Dollar as investors continue to assess the latest US CPI readings and the potential Fed’s rate path.

GBP/USD remains well bid around 1.3650

GBP/USD remains well bid around 1.3650

GBP/USD maintains its upside momentum in place, hovering around daily highs near 1.3650 and setting aside part of the recent three-day drop. Cable’s improved sentiment comes on the back of the Greenback’s  irresolute price action, while recent hawkish comments from the BoE’s Pill also collaborate with the uptick.

USD/JPY edges up above 153.50 with all eyes on US CPI figures

USD/JPY edges up above 153.50 with all eyes on US CPI figures

USD/JPY appreciates above 153.00 but remains on track for a 2.4% weekly loss. Trading volumes remain subdued on Friday, ahead of the IS CPI release. The Yen remains supported by hopes of a stable government and calls for further BoJ tightening.


Editors’ Picks

EUR/USD: Yes, the US economy is resilient – No, that won’t save the US Dollar

EUR/USD: Yes, the US economy is resilient – No, that won’t save the US Dollar Premium

Some impressive US data should have resulted in a much stronger USD. Well, it didn’t happen. The EUR/USD pair closed a third consecutive week little changed, a handful of pips above the 1.1800 mark. 

Gold: Metals remain vulnerable to broad market mood

Gold: Metals remain vulnerable to broad market mood Premium

Gold (XAU/USD) started the week on a bullish note and climbed above $5,000 before declining sharply and erasing its weekly gains on Thursday, only to recover heading into the weekend. 

GBP/USD: Pound Sterling remains below 1.3700 ahead of UK inflation test

GBP/USD: Pound Sterling remains below 1.3700 ahead of UK inflation test Premium

The Pound Sterling (GBP) failed to resist at higher levels against the US Dollar (USD), but buyers held their ground amid a US data-busy blockbuster week.

Bitcoin: BTC bears aren’t done yet

Bitcoin: BTC bears aren’t done yet

Bitcoin (BTC) price slips below $67,000 at the time of writing on Friday, remaining under pressure and extending losses of nearly 5% so far this week.

US Dollar: Big in Japan

US Dollar: Big in Japan Premium

The US Dollar (USD) resumed its yearly downtrend this week, slipping back to two-week troughs just to bounce back a tad in the second half of the week.

RECOMMENDED LESSONS

5 Forex News Events You Need To Know

In the fast moving world of currency markets where huge moves can seemingly come from nowhere, it is extremely important for new traders to learn about the various economic indicators and forex news events and releases that shape the markets. Indeed, quickly getting a handle on which data to look out for, what it means, and how to trade it can see new traders quickly become far more profitable and sets up the road to long term success.

Top 10 Chart Patterns Every Trader Should Know

Chart patterns are one of the most effective trading tools for a trader. They are pure price-action, and form on the basis of underlying buying and selling pressure. Chart patterns have a proven track-record, and traders use them to identify continuation or reversal signals, to open positions and identify price targets.

7 Ways to Avoid Forex Scams

The forex industry is recently seeing more and more scams. Here are 7 ways to avoid losing your money in such scams: Forex scams are becoming frequent. Michael Greenberg reports on luxurious expenses, including a submarine bought from the money taken from forex traders. Here’s another report of a forex fraud. So, how can we avoid falling in such forex scams?

What Are the 10 Fatal Mistakes Traders Make

Trading is exciting. Trading is hard. Trading is extremely hard. Some say that it takes more than 10,000 hours to master. Others believe that trading is the way to quick riches. They might be both wrong. What is important to know that no matter how experienced you are, mistakes will be part of the trading process.

Strategy

Money Management

Psychology

Best Brokers of 2025