The US Dollar Index: A useful tool for your trading

The US dollar has been the anchor currency of the international financial systems for decades. It is the currency of the largest economy with the most liquid financial market of the world and therefore there is no way around it. The US Dollar Index is an easy way to observe the development of the US dollar compared to the most important foreign currencies. In this article we talk about the calculation, the correlation to other asset-classes and how to use this knowledge in trading.
The US Dollar Index (USDX) represents the value of the US dollar compared to a basket of six currencies. It was introduced in the year 1973 with a value of 100 and it is traded as a futures contract at the ICE futures US. The US Dollar Index represents a geometrically weighted average of the US currency compared to the following currencies:
• Euro (EUR)
• Japanese yen (JPY)
• British pound (GBP)
• Canadian dollar (CAD)
• Swedish crown (SEK)
• Swiss franc (CHF)
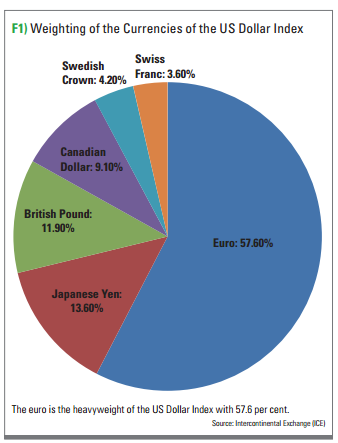
Up to 1998 the Deutsche Mark had been the largest of the participants of the index (there were ten at that time) at almost 21 per cent. Since then the euro has been the heavy weight of the index with 57.6 per cent. The weighting of the individual currency pairs is fixed and was only adapted in 1999 in the course of the introduction of the euro. Figure 1 shows the weighting of all currency pairs of the index in per cent. The formula for the calculation of the US Dollar Index is as follows:
The US Dollar Index (USDX) represents the value of the US dollar compared to a basket of six currencies. It was introduced in the year 1973 with a value of 100 and it is traded as a futures contract at the ICE futures US. The US Dollar Index represents a geometrically weighted average of the US currency compared to the following currencies:
• Euro (EUR)
• Japanese yen (JPY)
• British pound (GBP)
• Canadian dollar (CAD)
• Swedish crown (SEK)
• Swiss franc (CHF)
Up to 1998 the Deutsche Mark had been the largest of the participants of the index (there were ten at that time) at almost 21 per cent. Since then the euro has been the heavy weight of the index with 57.6 per cent. The weighting of the individual currency pairs is fixed and was only adapted in 1999 in the course of the introduction of the euro. Figure 1 shows the weighting of all currency pairs of the index in per cent. The formula for the calculation of the US Dollar Index is as follows:
50.14348112 x ((EUR ^ 0,576) x (JPY ^ 0.136) x (GBP ^ 0.119) x (CAD ^ 0.091) x (SEK ^ 0.042) x (CHF ^ 0.036))
The volume-weighted US Dollar Index – also called “Broad Index” – is an alternative and accurate index, but it is not tradable. The Federal Reserve has calculated it since 1988. Here as well the US currency is compared to a (considerably larger) basket of goods. But the weighting of the currencies depends on the size of the particular volume of import and export. Therefore the Chinese yuan, which is not represented in the US Dollar Index, is the heavy weight beside the euro. However both indices show a similar development.
Historical Development
The US Dollar Index is a great tool for analysis. At a glance you see the strength as well as the weakness of the US dollar compared to the main currencies: If the index rises, the US dollar is strong compared to the other major currencies. If the US Dollar Index decreases, it is a signal of the weakness of the US dollar against the other major currencies.
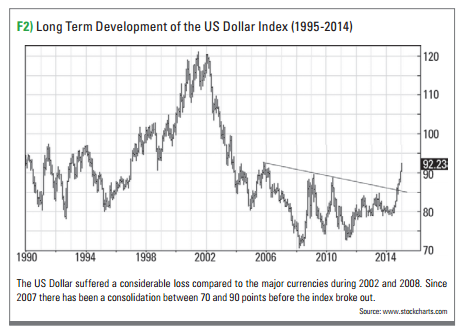
Figure 2 shows the volatile ups and downs of the index during the past decades. The most important milestone of recent history is the bursting of the commodities bubble in 1980. It is mainly attributed to the US dollar forming a bottom and then doubling its value within the following five years. Between 1985 and 1995 the US Dollar Index showed a considerable phase of weakness and then strengthened by 50 per cent until summer of 2001. The expansive policy of the US Fed caused a drop of 72 points at the beginning of 2008. The intensification of the global financial crisis catapulted the index near the 90-point-level within a few months, where it started to build a long consolidation. In late 2014, the index finally started to run upwards again.
Figure 2 shows the volatile ups and downs of the index during the past decades. The most important milestone of recent history is the bursting of the commodities bubble in 1980. It is mainly attributed to the US dollar forming a bottom and then doubling its value within the following five years. Between 1985 and 1995 the US Dollar Index showed a considerable phase of weakness and then strengthened by 50 per cent until summer of 2001. The expansive policy of the US Fed caused a drop of 72 points at the beginning of 2008. The intensification of the global financial crisis catapulted the index near the 90-point-level within a few months, where it started to build a long consolidation. In late 2014, the index finally started to run upwards again.

Author

Traders' Contributors
Traders' Magazine
More from Traders' Contributors


