The Psychological Ebbs and Flows of Market Cycles

All markets go through different cycles that produce different psychological effects to those that participate. At the highest point of the market cycle traders and investors feel good about the returns they’ve realized, this is usually followed by a sense of dread when they see those returns begin to dwindle, slowly turning into losses. Unfortunately, this happens more often than not. This is due to the simple fact that most traders and investors don’t have a plan to properly manage risk and thus are subject to their emotions of fear and greed. Moreover, they also don’t have a strategy that helps them time the market. Meaning they don’t know when to get in (buy low) and get out (sell high). As you might imagine, this poses a big challenge for most traders and investors.
In order to deal with some of these challenges a trader/investor must understand the various stages of trading psychology. The caption below illustrates those different psychological phases that both traders and investor go through during various market cycles.
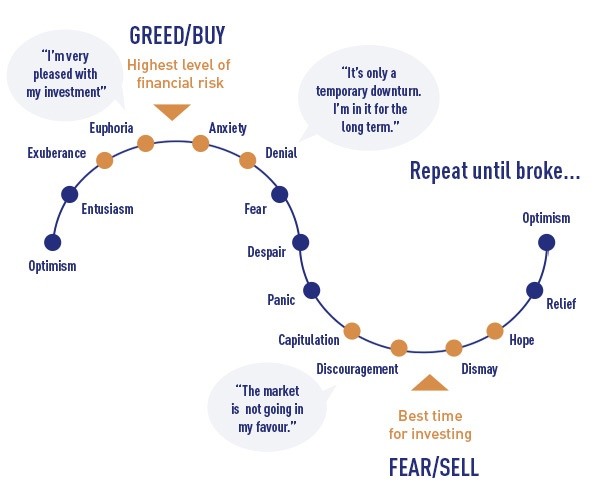
The first phase as the market cycles is optimism. This happens when the market has been in a sustained uptrend for many months and the prospects for earnings and the economy are starting to recover. Traders are feeling comfortable buying as they see little reason to not put some money into the market. As the market continues higher optimism turns into excitement as the earlier buyers are starting to garner profits and every pullback is seen as another buying opportunity. That’s because buyers are being rewarded for purchasing every retracement. As the market accelerates to the upside the “thrill” phase begins as profits increase substantially and investor confidence is through the roof. Then comes the Euphoria phase which is when profits come so easy that most traders and investors feel they must take on leverage and begin to ignore simple risk management principles. Although on the surface it seems like nothing can go wrong, the reality is that this is the point of maximum risk in the cycle, everyone is just too blinded by greed to come to this realization. This phase is where institutional investors have tons of liquidity to unload a bunch of stock as there are huge numbers of willing buyers. This is the distribution phase.
As the new pool of buyers begins to diminish the market starts to rollover. Initially it looks like another garden-variety pullback, that is, until the market fails to take out the prior high watermark and the prior lows are breached. This kicks off the “anxiety’ phase of the cycle as some of those “easy” profits begin to not be so easy anymore. In addition, some of the earlier gains begin to slowly evaporate.
The” denial “phase begins as investors start to rationalize their decisions for holding on to losing trades as good long-term opportunities that will eventually come back. As the market continues lower and the losses continue to mount, denial turns into fear that causes paralysis and confuses traders and investors into doing nothing (like a deer in the headlights).
Persistent selling causes a sense of desperation to take hold among traders and investors as the resolve to hold on for the long term starts to crack. It doesn’t take that much time for panic to set in, as the terrible reality of what the losses mean for every trader is too much to bear. This is the most emotional phase as the pain becomes overwhelming.
With this intensified selling, traders and investors reach their breaking point. This is referred to as the “capitulation” or give-up phase in which traders and investors have to sell to relieve that excruciating pain that they’re in. This is the point of maximum financial opportunity as the institutions are accumulating shares and buying futures contracts for the recovery that most likely is forthcoming.
Invariably, the market does recover after the majority have given up and that causes investors to become despondent and depressed as they realize that they have made a terrible mistake in selling near the lows. This phase is where many question whether they should be traders, or in the markets at all.
Finally, as the market slowly recovers, investors slowly become hopeful again and begin dipping their toes into the water, so to speak. This happens only after a sustained rally is underway of course, and the market cycle begins again.
If we succumb to the emotional roller coaster of investing and trading as pictured in the illustration, we’ll eventually end up broke. Instead, implementing a low-risk, high probability strategy that helps us time the market, and navigate through this emotional cycle is the best course of action. In which phase do you think the market is in today?
Until next time I hope everyone has a great week.
Author

Gabe Velázquez
Online Trading Academy
Gabe got his start in the markets as a broker trainee for Paine Webber, a mere 3 months before the market crash of 1987. He witnessed the gut wrenching fear of investors during that time period and the wild speculative euphoria of the late 90's.