![]() Russ Allen
Russ Allen
Online Trading Academy
In last month’s article, Rate of Return and Risk, I discussed how return and risk are related. One of the key points was that the types of assets that produce the highest returns also provide the greatest risk of losing principal (like stocks); another was that overall market risk can be reduced by diversifying among different investments.
Building on that theme, today we’ll look at how you can add together multiple assets whose prices are individually volatile, and yet end up with a portfolio whose overall volatility is much less than any of its components. In other words, how to create a portfolio where as far as market risk is concerned, the whole is less than the sum of the parts.
Doing this requires that we choose assets whose individual price movements are as uncorrelated with each other as possible. That absence of correlation is the key. Investing in a hundred different instruments does not reduce market risk if they all rise and fall together. The fall together part is what needs to be avoided.
Consider the following chart:
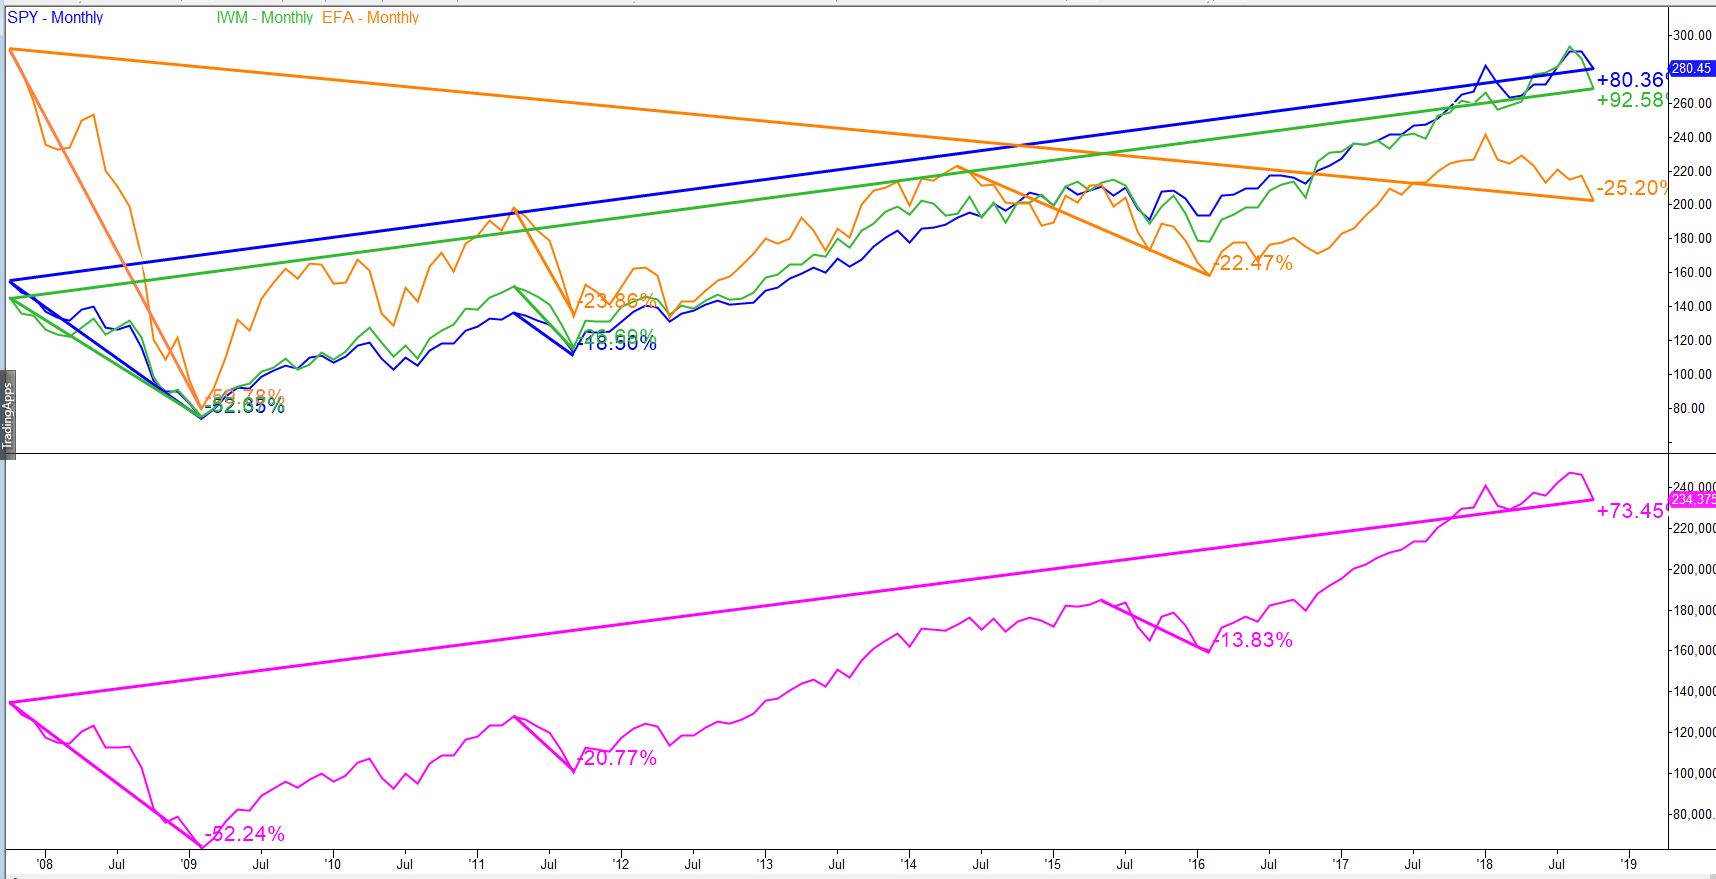
This is a hypothetical portfolio consisting of three different assets:
-
SPY, the exchange-traded fund representing the S&P 500 Index (blue line)
-
IWM, the Russel 200 Small-cap ETF (green line)
-
EFA, the Europe-Australasia-Far East ETF. Each one of these ETFs consists of hundreds of separate stocks. (orange line)
In the lower part of the diagram is a line (magenta) representing the value of a portfolio consisting of equal amounts of each of these three ETFs, re-balanced annually, over an eleven-year period of time (late 2007 – today). This period was chosen specifically to include the crash of 2008. Our point here is to protect against market risk, and that crash is exactly the kind of risk we mean. Re-balancing the portfolio provides part of the effect we describe below. The rest was provided by dividing up the portfolio in the first place. More about re-balancing in a future article.
Note these points from the above graph:
-
Although somewhat different in their movements, all three of these ETFs do represent different slices of the same asset class – stocks.
-
All three usually rise and fall at the same time, if at different rates.
-
Adding these three correlated assets together into a portfolio buffers the worst drops of the individual assets only somewhat. In 2008, the worst loser of the group was EFA, down over 59% peak-to-trough, with both IWM and SPY down over 52%. The combined portfolio was down about 52%. Later in the time period, some of the assets had quite notable drops of 18% to 22%, while the combined portfolio’s losses were only somewhat muted.
-
The overall 11-year return, at +73%, was intermediate between the individual returns (-25% to +92%), as would be expected.
Adding together these particular assets reduced our overall market risk only minimally and we ended up with just an average return (that is, it was the average of the returns on the three individual assets).
Compare that to a different set of three assets, this time chosen because they are historically not correlated with each other.
-
SPY again, representing stocks (blue line)
-
TLT, the ETF that tracks the prices of long-term U.S. government bonds (green line)
-
GLD, the ETF that tracks the price of gold. Stocks, bonds and gold have been known, for decades at least, to be non-correlated (orange line)
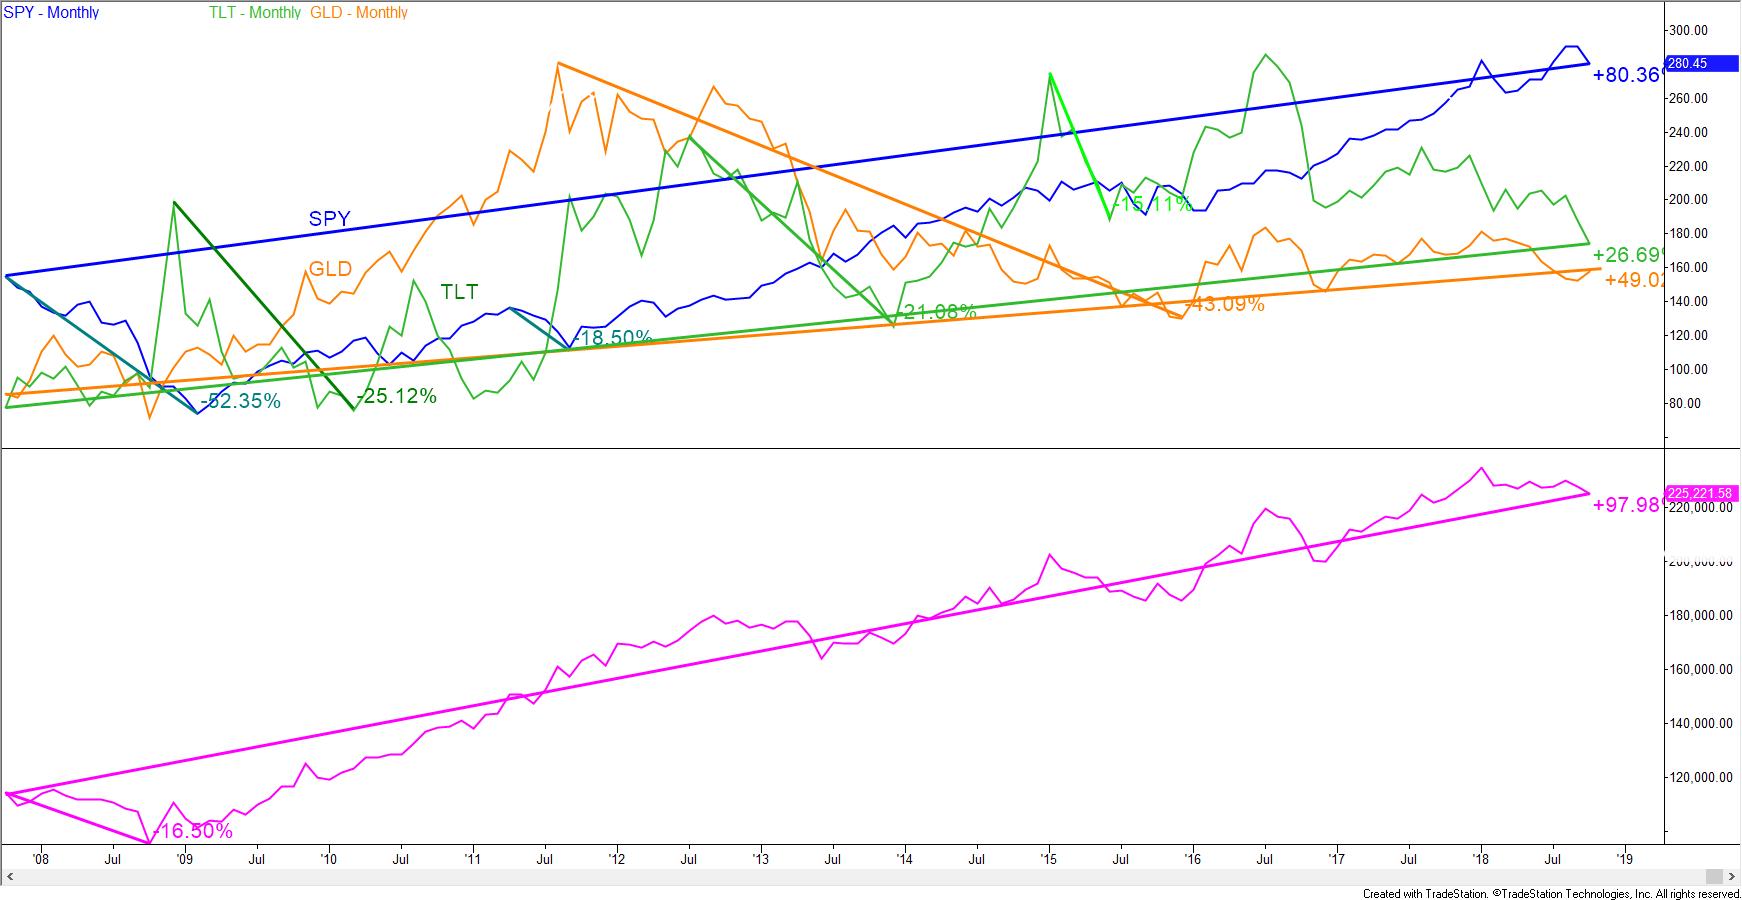
Here are the key points from this diagram:
-
These three assets are very different in their movement because they represent completely different asset classes. Stocks, bonds and gold are nothing like each other. Bonds and gold are not part of what we refer to when we say the market.
-
All three virtually never fell simultaneously; although each one individually had multiple major drops of anywhere from 15% to 52%.
-
Adding these three non-correlated assets together into a portfolio produced a combined portfolio that buffered the worst drops of the individual assets to a very large extent. In 2008, the worst loser of the group was down 52%; but in that bloodbath for the stock market this combined portfolio dropped only 16.5%.
-
The overall 11-year return, at +98%, was greater than any of the individual returns (+27% to +80%)!
This last point is definitely not what one would expect. But it happened because the value of the portfolio as a whole never fell into a deep decline. This is a consequence of the simple mathematics of avoiding large percentage losses (where a 50% drop, for example, requires a 100% gain to get even).
The ups and downs in the individual components actually damp out overall volatility – as long as those individual assets are uncorrelated.
In summary, a portfolio of assets which are uncorrelated with each other can be expected, over time, to produce both higher average returns and smaller major losses than a single volatile asset; or of a combination of assets that are correlated.
And that’s a conclusion that you can take to the bank.
Read the original article here - Subtracting Volatility by Adding It
This content is intended to provide educational information only. This information should not be construed as individual or customized legal, tax, financial or investment services. As each individual's situation is unique, a qualified professional should be consulted before making legal, tax, financial and investment decisions. The educational information provided in this article does not comprise any course or a part of any course that may be used as an educational credit for any certification purpose and will not prepare any User to be accredited for any licenses in any industry and will not prepare any User to get a job. Reproduced by permission from OTAcademy.com click here for Terms of Use: https://www.otacademy.com/about/terms
Editors’ Picks

EUR/USD hits two-day highs near 1.1820
EUR/USD picks up pace and reaches two-day tops around 1.1820 at the end of the week. The pair’s move higher comes on the back of renewed weakness in the US Dollar amid growing talk that the Fed could deliver an interest rate cut as early as March. On the docket, the flash US Consumer Sentiment improves to 57.3 in February.

GBP/USD reclaims 1.3600 and above
GBP/USD reverses two straight days of losses, surpassing the key 1.3600 yardstick on Friday. Cable’s rebound comes as the Greenback slips away from two-week highs in response to some profit-taking mood and speculation of Fed rate cuts. In addition, hawkish comments from the BoE’s Pill are also collaborating with the quid’s improvement.

USD/JPY drops back below 157.00, as focus shifts to Japan snap election
USD/JPY is back in the red below 157.00 in the Asian session on Friday. The Japanese Yen recovers ground against the US Dollar amid some profit-taking ahead of Japan's snap general election on Sunday. The preliminary reading of the Michigan Consumer Sentiment Index report for February will be released later on Friday.
Editors’ Picks

EUR/USD: US Dollar to remain pressured until uncertainty fog dissipates Premium
The EUR/USD pair lost additional ground in the first week of February, settling at around 1.1820. The reversal lost momentum after the pair peaked at 1.2082 in January, its highest since mid-2021.

Gold: Volatility persists in commodity space Premium
After losing more than 8% to end the previous week, Gold (XAU/USD) remained under heavy selling pressure on Monday and dropped toward $4,400. Although XAU/USD staged a decisive rebound afterward, it failed to stabilize above $5,000.

GBP/USD: Pound Sterling tests key support ahead of a big week Premium
The Pound Sterling (GBP) changed course against the US Dollar (USD), with GBP/USD giving up nearly 200 pips in a dramatic correction.

Bitcoin: The worst may be behind us
Bitcoin (BTC) price recovers slightly, trading at $65,000 at the time of writing on Friday, after reaching a low of $60,000 during the early Asian trading session. The Crypto King remained under pressure so far this week, posting three consecutive weeks of losses exceeding 30%.

Three scenarios for Japanese Yen ahead of snap election Premium
The latest polls point to a dominant win for the ruling bloc at the upcoming Japanese snap election. The larger Sanae Takaichi’s mandate, the more investors fear faster implementation of tax cuts and spending plans.
RECOMMENDED LESSONS
Making money in forex is easy if you know how the bankers trade!
I’m often mystified in my educational forex articles why so many traders struggle to make consistent money out of forex trading. The answer has more to do with what they don’t know than what they do know. After working in investment banks for 20 years many of which were as a Chief trader its second knowledge how to extract cash out of the market.
5 Forex News Events You Need To Know
In the fast moving world of currency markets where huge moves can seemingly come from nowhere, it is extremely important for new traders to learn about the various economic indicators and forex news events and releases that shape the markets. Indeed, quickly getting a handle on which data to look out for, what it means, and how to trade it can see new traders quickly become far more profitable and sets up the road to long term success.
Top 10 Chart Patterns Every Trader Should Know
Chart patterns are one of the most effective trading tools for a trader. They are pure price-action, and form on the basis of underlying buying and selling pressure. Chart patterns have a proven track-record, and traders use them to identify continuation or reversal signals, to open positions and identify price targets.
7 Ways to Avoid Forex Scams
The forex industry is recently seeing more and more scams. Here are 7 ways to avoid losing your money in such scams: Forex scams are becoming frequent. Michael Greenberg reports on luxurious expenses, including a submarine bought from the money taken from forex traders. Here’s another report of a forex fraud. So, how can we avoid falling in such forex scams?
What Are the 10 Fatal Mistakes Traders Make
Trading is exciting. Trading is hard. Trading is extremely hard. Some say that it takes more than 10,000 hours to master. Others believe that trading is the way to quick riches. They might be both wrong. What is important to know that no matter how experienced you are, mistakes will be part of the trading process.
The challenge: Timing the market and trader psychology
Successful trading often comes down to timing – entering and exiting trades at the right moments. Yet timing the market is notoriously difficult, largely because human psychology can derail even the best plans. Two powerful emotions in particular – fear and greed – tend to drive trading decisions off course.