How to pick the best stock for option selling

One of the questions that I receive all the time is how exactly do I find the best stocks that I want to sell put options on?
And this is what I want to show you right now.
For the past few weeks, I have been selling puts and it has been working really, really great.
When selling puts, I have my own checklist.
Checklist: Picking The Best Stock For Option Selling
Here you see the checklist with the 15 points to picking the best stock for option selling.
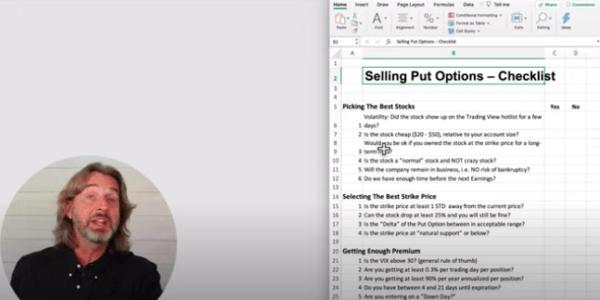
One of the first things that I’m looking for is volatility since I’m selling options.
When selling options you want to have a lot of volatility because this is when the premiums are high.
So I want to see that this stock shows up on the TradingView hotlist for a few days.
I want to show you exactly how I’m doing this, and then also I’d like to look for stocks that are relatively cheap between $20 and $50.
I need to make sure, especially when selling puts, that I’m okay owning the stock at the strike price for a long term hold.
So as you can see, it is a 15 point checklist that I have here and today I want to walk you through these first few steps here.
So let’s get started.
Let’s talk about the scanner and the hotlist.
Option Selling: Scanner And Hotlist
As you know, I like to use TradingView and it has a stocks “hotlist” on the upper right-hand side.
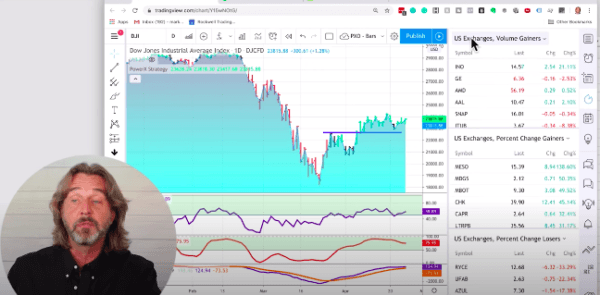
This is where it shows for the US exchanges, the volume gainers for today, the percentage change gainers, and the percentage change losers.
So as you can see today, INO moved up 21%, GE moved down 2%, AMD moved up 0.5%.
So I’m looking for stocks that had a substantial down move because this is part of the checklist that we need to make sure we are entering on a down day.
You see, this is step number 15 on this checklist here. So I want to find stocks that have been on this list for quite a few days.
Recently I also created my own scanner and I want to show you how exactly I go about finding the best stocks.
TradingView has a stock screener built-in, so I created a stock screener here and right now I’m removing the indicators to make it a little bit easier for me.
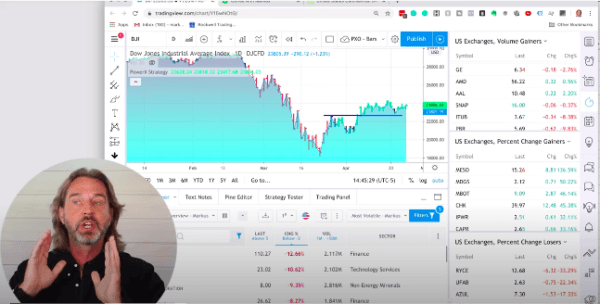
So here’s what I’m looking for when picking the best stock for option selling.
I want to see:
Common stocks
That the last price is above $5
I don’t care about:
Preferred stocks
ETFs because especially for this strategy, it has worked best when trading it on stocks
Penny stocks or anything below $5
Now, in terms of the change, I want to see that we are down at least 2%. The more the better. The volume, I want to see that we have 1 to 50 million.
And it shows you the sector, I’m not too interested in the sector.
Volatility
One of the things on the checklist is we need to make sure that there’s enough volatility, that the stock is relatively cheap, especially when you’re trading a smaller account.
This is super important: Would you be okay if you owned the stock at the strike price for a long term hold?
So here’s what I like to do in order to figure this out.
I want to actually switch to a weekly chart. I’m just zooming out that I see the past few years.
Now I’m clicking on the first stock so that it automatically shows me the weekly chart.

And as you can see, this stock has been going up, still fairly expensive. And right now, it is down today, 12%.
It says in the finance sector, I’m not too interested in this stock.
So let’s take a look at another one, XP. XP is a stock that just recently started trading and one of the criteria that I have is “no crazy stock.”

For me, this looks more like a crazy stock. Let’s see if we find something that makes more sense.
Let’s look at Arconic Corporation.
Here’s what I’m looking for:
I want to see that over the past few years, it has been trading at a fairly high level and just recently because of the market crash has been crashing down.
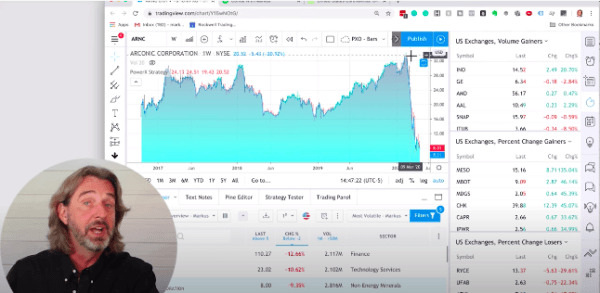
So this actually looks fairly interesting.
I want to make sure that I’m not trading into earnings, and we have 39 days until earnings, so I’m flagging this as a possibility.
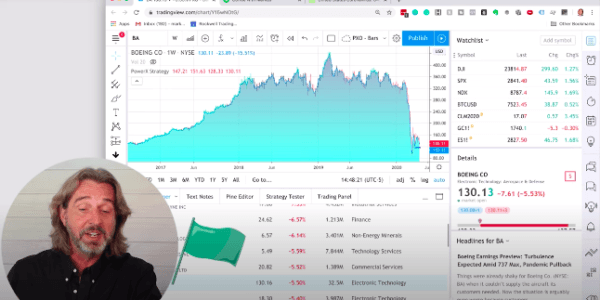
Here’s Boeing. Boeing is a good one.
Reporting earning in five days. Not too good. I’m going to flag it now anyhow, just so that I can show you the process.
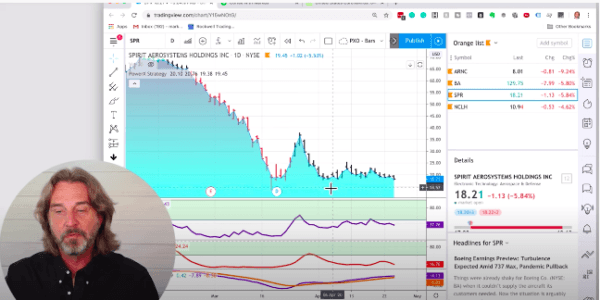
What else do we have? Spirit. That’s good. Spirit Aerosystems Holdings. 12 days to expiration.
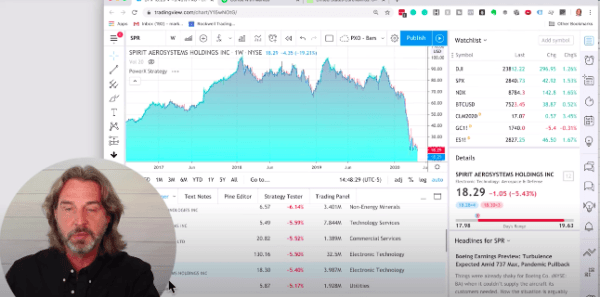
As you can see, over the past years, since 2017, they have been trading between $60 and $90. Right now, they plummeted to $18.
That could be an interesting one too, let’s flag this one.
NCLH, I’ve always liked this one and I’ve been trading it recently.
I want to keep it easy here because I want to show you the next step that I do.
Now, again, NCLH right now has earnings in 12 days. So we’re still okay there I believe.
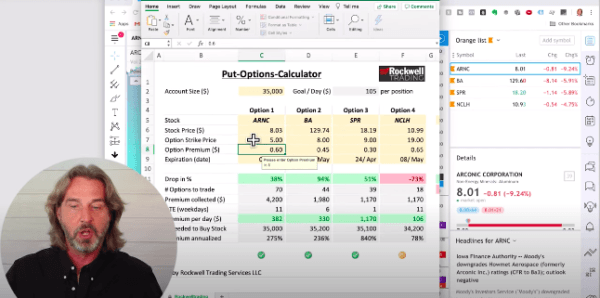
So this is where then I use my put option calculator and I’m now picking my watch list for the symbols that I flagged.
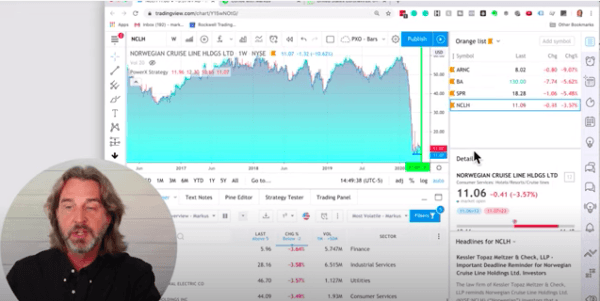
As you see above, I have ARNC, BA, SPR and NCLH.
Let’s go back to my put options calculator.
Option Selling: Finding The Best Strike Price
I’m putting in ARNC, BA, NCLH and SPR.
I’m entering the exact price that they’re trading at right now to see if there is enough premium in there and what’s strike price I should trade.

Now, what I need to do next is that I’ll look for some natural support and resistance.
Natural Support Or Resistance
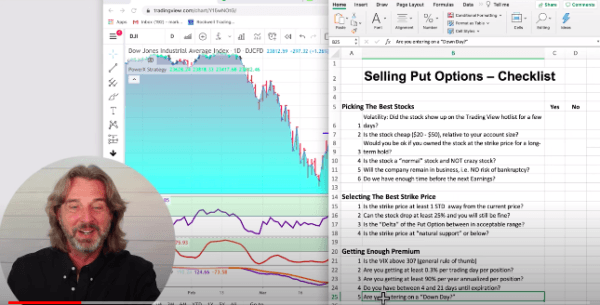
So I’m going back to my checklist, right? Because this is where we are now selecting the best strike price.
Is the strike price at least one STD away?
Can it drop at least 25%?
Is the delta in an acceptable range?
Is the strike price at natural support below?
So that’s what we’re gonna do right now.
Next step, now that we have these four stocks, let’s actually see if we have some natural support or resistance that we can use here.
So I’m switching to a daily chart and I start with ARNC.
Looking at ARNC it seems that right here at the $5 level there is some natural support. So we didn’t dip below the $5 level.
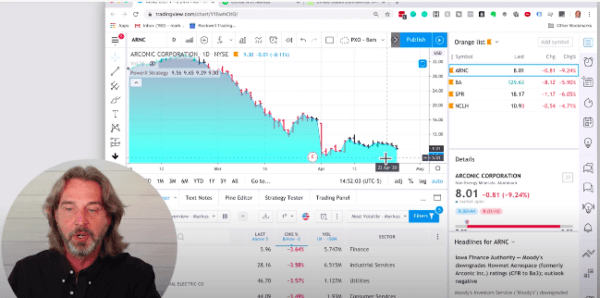
Roughly I put in the strike price here of $5 and we see we can drop 38%. So that’s pretty good.
Now we do the same for BA, for Boeing.
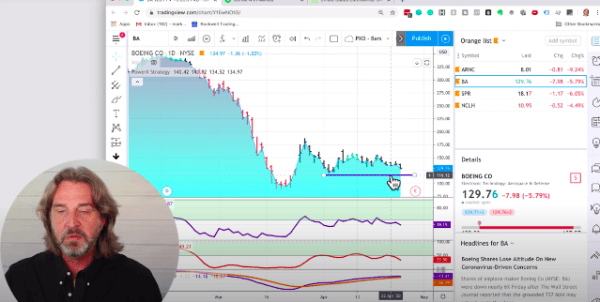
$110 would only drop 15%, so we might have to go for a $90 strike price.
SPR seems that in SPR here probably around $12 — $13. So let’s try this.
NCLH I like the $8 level here a lot, this is what I recently traded.
I closed out a trade today with over a $1,000 or $1,300 profit on NCLH. So we probably have to go for $8 or maybe even $7.50.
Now we are good to go. The stock can drop at least 25% in all of these forms. Now it’s a matter of finding enough premium here and expiration.
We have seven minutes going into the close, so let’s quickly jump onto the trading platform, the option trader.
Let’s look at some premiums for these instruments to see if it actually makes sense to trade them.
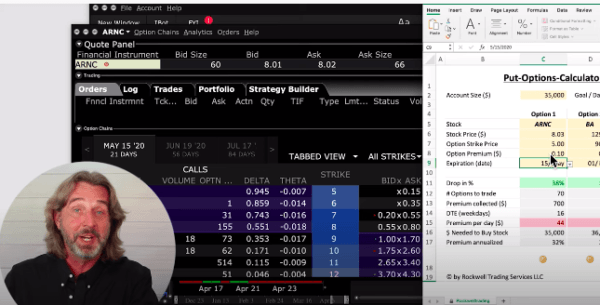
ARNC Options Premium
We’ll start with ARNC. We want to see if we have some options, they expire May 15th.
And let’s say at the $5 strike price, what we can get at a bid ask. To be honest, with the $5 strike price we probably can only get $0.30.
If we would get $0.30 we would make $131 per day. That sounds good.
We could actually go as low as 0.25, and it would still meet my criteria.
The bid ask just changed to $0.15, so realistically, we could probably get only one.
I know that I’m going fairly quickly here, I just wanted to give you a high-level overview, on how I think when setting up these trades.
BA Options Premium
Let’s move on to BA. I want to do the same, maybe something that expires May 15.
So let’s take a look at the $90 strike price. We’ll get probably $1.73. So we have more reliable data here.

That does not look good, it would only give me $43 a day. I want to see at least $100 a day.
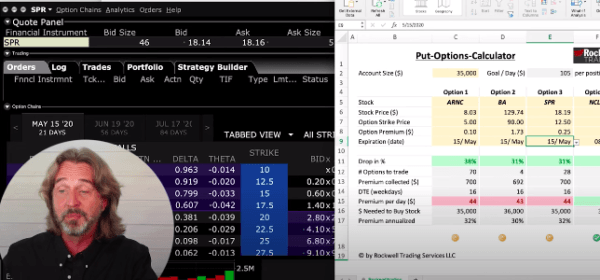
SPR Options Premium
So here we’re looking at a strike price of $12. We only have a strike price of $12.50. That’s not too bad. And May 15 we would get $0.25.
So let’s see. $12.50 also only $44.
NCLH Options Premium
Let’s take a look at the last one, NCLH. So this Norwegian Cruise Lines and we’re looking at a possible $7.50 strike.
OK, we can maybe get $0.30, $0.35 to see if I get the green light for this. And I’m looking at May 15, $103.
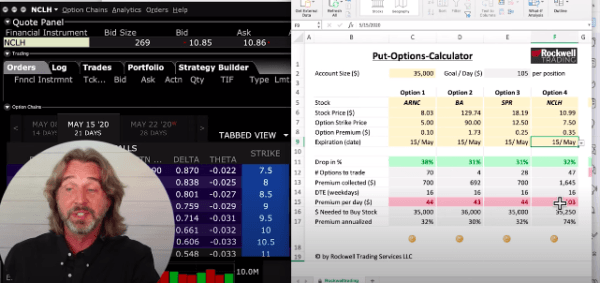
You see, I want to make $105. $103, this looks good. So you see how we quickly narrowed it down. Out of all the stocks.
Option Selling Recap
Let me just repeat the steps here fairly quickly.
So what I did in probably 10 minutes or less, I went to the stock screener for today, there were 42 stocks.
Out of these 42 stocks, we quickly identified around four stocks that we want to take a look at.
With these four stocks we then quickly went to the put options calculator and saw that three of them did not make sense, but NCLH is making sense.
Now again, I know that NCLH is reporting earnings fairly soon. 12 days, that’s actually not too bad.
The earnings (at the time of this post) supposedly are on May 7th and we have our expiration as May 15th.
I usually don’t hold right into expiration, usually, I’m closing it before expiration. So this actually could be a nice and valid trade.
One More Look At NCLH
Let’s go back to NCLH and play around a little bit with the expirations.
If we go for a shorter expiration of May 8th at the $7 strike price, we would probably get $0.15, let’s see. We would get $0.15.
Does this make sense, going to the 8th? No, only $64. No fun there, so we stay at the at this expiration, May 15th at $7.50.
And again, if we could get $0.35, we would be almost good to go. See, ideally, if we would get $0.40 we’d make $118 per day.
I want to see a minimum of $105. If I can make $103 a day instead of $105, I’ll be fine.
So out of the four that we’ve looked at, NCLH is the one that I would take a closer look at.
NCLH is definitely a stock that I will take a look at on the next trading day when the markets open.
I hope this helps. By now you know how to find the best stocks if you want to sell options.
Author

Markus Heitkoetter
Rockwell Trading
As founder and CEO of Rockwell Trading Services LLC., Markus Heitkoetter has shared his trading methods and ideas with more than 300,000 traders in over 196 countries.