![]() Gabe Velázquez
Gabe Velázquez
Online Trading Academy
One of the many challenges a new trader faces is finding the optimal time interval for the candlesticks they plot on their charts. The trading approach or style a trader decides to implement will, of course, have a big influence. For instance, a weekly income trader (one who intends on holding positions for days and weeks) will have little use for a 5 minute chart. On the other hand, a short-term income trader may find a 5 minute chart an essential part of their analysis.
The most commonly used time frames for short-term traders are: Daily, 60-minute and 5-minute candles. When deciding which period to utilize, one must keep in mind that the shorter the time frame, the noisier the chart. In other words, the shorter time frames generate many more zones; however, these zones have a higher propensity to fail.
Traders that use ultra short-term charts (1 minute or less) are usually what we refer to in the industry as scalpers. These traders are in and out of the market in rapid-fire succession, typically taking 3 to 5 tick profits (futures markets); they compensate for the high commission costs and the smaller profits by having a high win-to-loss ratio (usually over 80%). This type of trading is not something I recommend for the new trader. This is partly because the approach requires a high degree of skill which can only be acquired through vast experience; and the competitive landscape for this type of trading is very crowded. Scalping is done mostly by high speed computers executing algorithms. The odds of competing successfully against computers is very low.
Those of us that look for bigger moves on an intraday basis observe several time frames simultaneously, which can be helpful to minimize risk and maximize the potential of our trades.
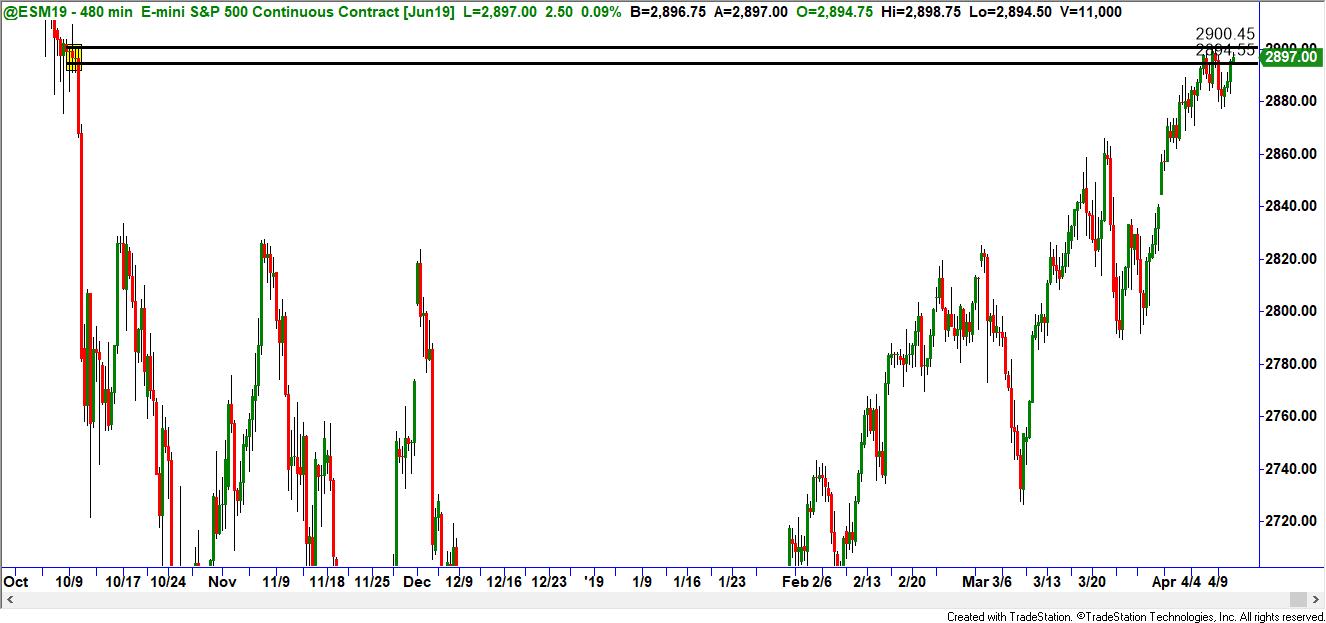
To illustrate this point, let’s look at a recent example in the E-Mini S&P 500. Below is an eight-hour chart of the aforementioned ES. Note that price had rallied into the Supply and started to fall away. The key is that this shorting opportunity had a high likelihood of selling off to the next demand zone. We must remember that trading is based on probabilities and we never have any certainty of success. What we do with these time frames is simply increase our odds of success.
Then, if we drill down to the shorter time frame (ten-minute), we are able to spot a low risk entry within the confines of the higher location (close to the higher time frame supply).
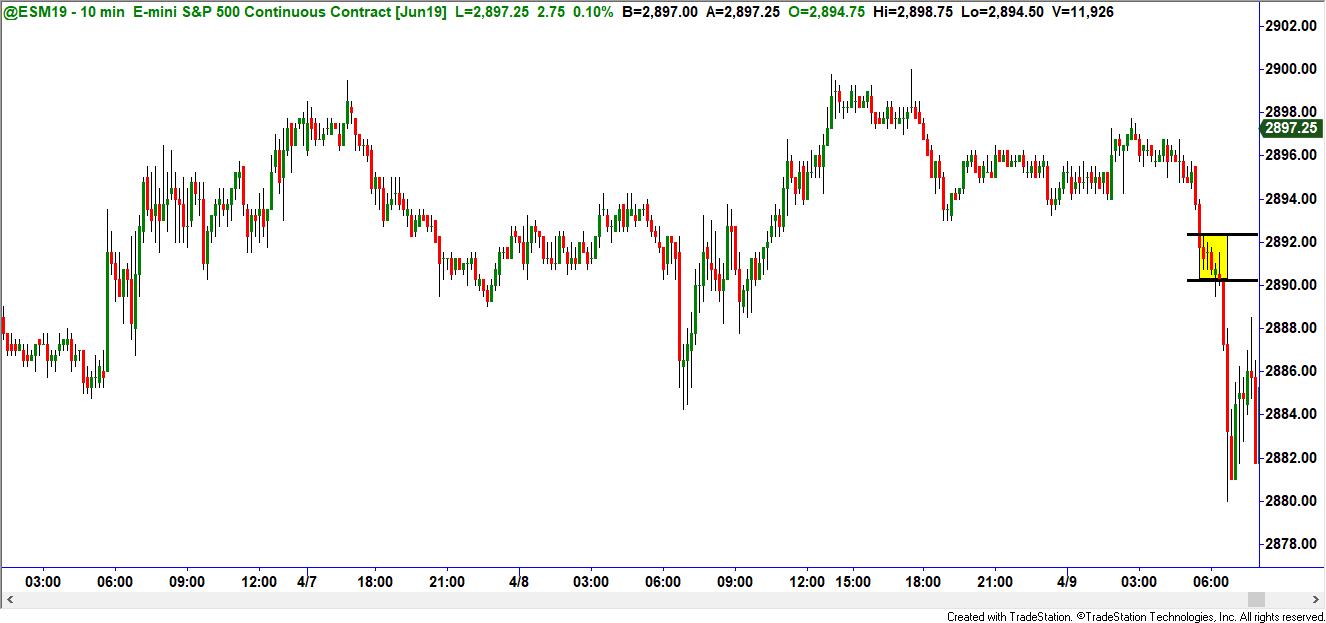
The ten-minute chart (shown above) gives us a low-risk entry because the basing in the zone is narrower on the smaller time-frame. This is true because the rate of change is less in smaller intervals.
Here’s the setup: The area highlighted in yellow is the entry. A limit order is placed at the proximal line and the stop is placed 2 ticks above the distal line.
Now that we’ve defined the entry and risk in this example, we need to find a profit objective that comports with a pre-determined risk-to-reward ratio.
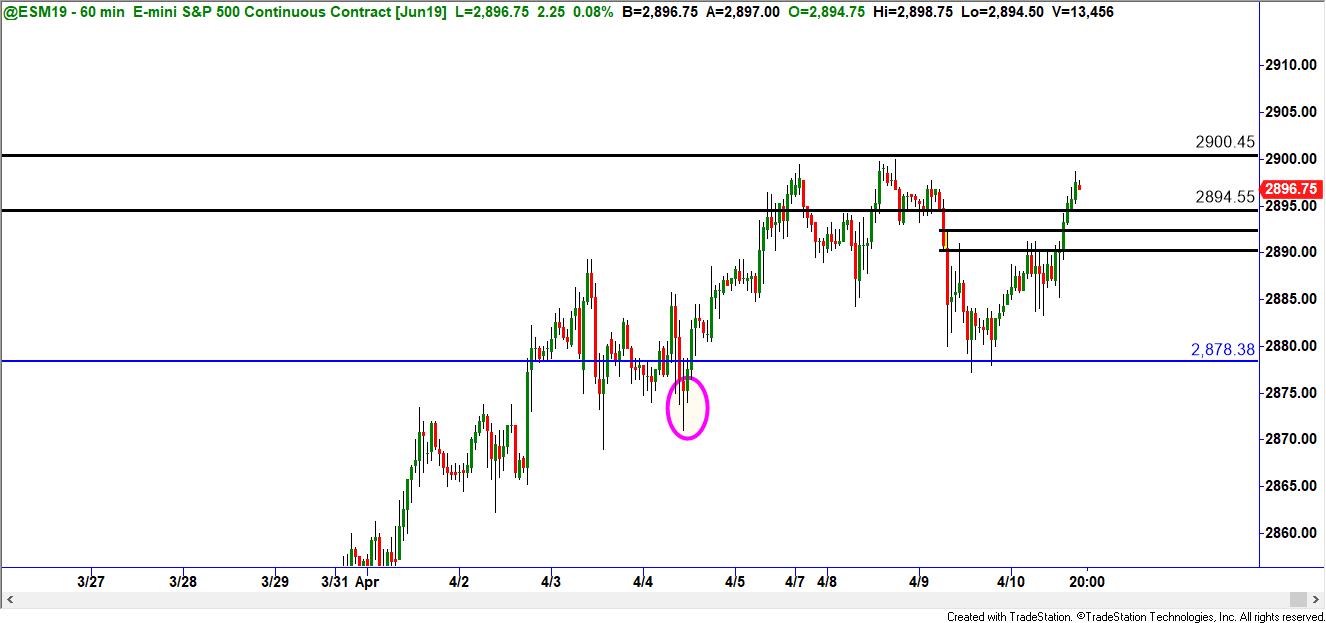
For this, we return back to the hourly chart (magenta circled area shown below); observe that once price stopped falling it moved sharply higher from that point. Objectively, this suggests there are buyers there. We want to take profits before we reach the area that increases our probabilities of hitting our target (the blue line).
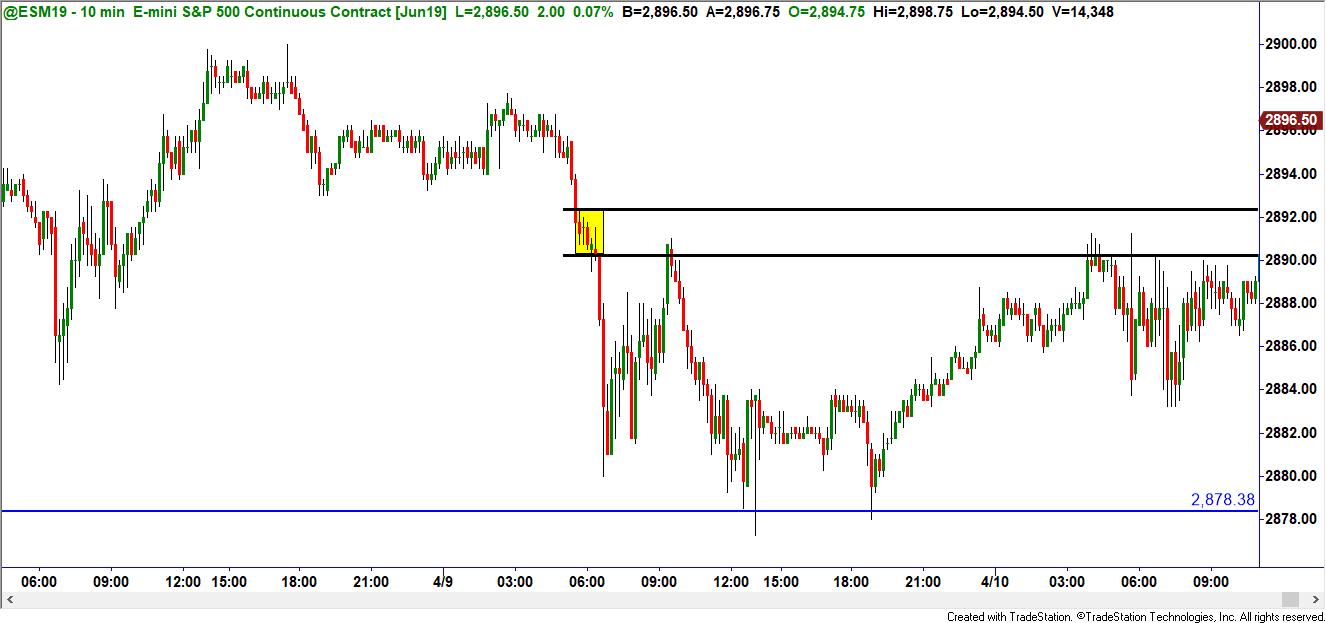
As you can see on the lower chart, this trade gave us an extremely favorable risk-to-reward ratio and turned well before the pivot low was reached. Trades like these do not come along every day; nonetheless, the best way to identify them when they do is by implementing multiple time frame analysis. By utilizing the lower time frames as triggers along with higher time frames as filters, you can find more trading opportunities.
As a trader, you need to be cognizant of what the market is doing in all time frames, regardless of your style of trading. In my experience, I find novice traders become myopic (short-sighted) in how they view the market; and by doing so, fail to spot good trades and/or make failing trades.
So, try expanding your time-zone horizons and see if that helps you reach your trading goals.
Read the original article here - Multiple Time Frames Help Complete the Picture
This content is intended to provide educational information only. This information should not be construed as individual or customized legal, tax, financial or investment services. As each individual's situation is unique, a qualified professional should be consulted before making legal, tax, financial and investment decisions. The educational information provided in this article does not comprise any course or a part of any course that may be used as an educational credit for any certification purpose and will not prepare any User to be accredited for any licenses in any industry and will not prepare any User to get a job. Reproduced by permission from OTAcademy.com click here for Terms of Use: https://www.otacademy.com/about/terms
Editors’ Picks

EUR/USD hits two-day highs near 1.1820
EUR/USD picks up pace and reaches two-day tops around 1.1820 at the end of the week. The pair’s move higher comes on the back of renewed weakness in the US Dollar amid growing talk that the Fed could deliver an interest rate cut as early as March. On the docket, the flash US Consumer Sentiment improves to 57.3 in February.

GBP/USD reclaims 1.3600 and above
GBP/USD reverses two straight days of losses, surpassing the key 1.3600 yardstick on Friday. Cable’s rebound comes as the Greenback slips away from two-week highs in response to some profit-taking mood and speculation of Fed rate cuts. In addition, hawkish comments from the BoE’s Pill are also collaborating with the quid’s improvement.

USD/JPY drops back below 157.00, as focus shifts to Japan snap election
USD/JPY is back in the red below 157.00 in the Asian session on Friday. The Japanese Yen recovers ground against the US Dollar amid some profit-taking ahead of Japan's snap general election on Sunday. The preliminary reading of the Michigan Consumer Sentiment Index report for February will be released later on Friday.
Editors’ Picks

EUR/USD: US Dollar to remain pressured until uncertainty fog dissipates Premium
The EUR/USD pair lost additional ground in the first week of February, settling at around 1.1820. The reversal lost momentum after the pair peaked at 1.2082 in January, its highest since mid-2021.

Gold: Volatility persists in commodity space Premium
After losing more than 8% to end the previous week, Gold (XAU/USD) remained under heavy selling pressure on Monday and dropped toward $4,400. Although XAU/USD staged a decisive rebound afterward, it failed to stabilize above $5,000.

GBP/USD: Pound Sterling tests key support ahead of a big week Premium
The Pound Sterling (GBP) changed course against the US Dollar (USD), with GBP/USD giving up nearly 200 pips in a dramatic correction.

Bitcoin: The worst may be behind us
Bitcoin (BTC) price recovers slightly, trading at $65,000 at the time of writing on Friday, after reaching a low of $60,000 during the early Asian trading session. The Crypto King remained under pressure so far this week, posting three consecutive weeks of losses exceeding 30%.

Three scenarios for Japanese Yen ahead of snap election Premium
The latest polls point to a dominant win for the ruling bloc at the upcoming Japanese snap election. The larger Sanae Takaichi’s mandate, the more investors fear faster implementation of tax cuts and spending plans.
RECOMMENDED LESSONS
Making money in forex is easy if you know how the bankers trade!
I’m often mystified in my educational forex articles why so many traders struggle to make consistent money out of forex trading. The answer has more to do with what they don’t know than what they do know. After working in investment banks for 20 years many of which were as a Chief trader its second knowledge how to extract cash out of the market.
5 Forex News Events You Need To Know
In the fast moving world of currency markets where huge moves can seemingly come from nowhere, it is extremely important for new traders to learn about the various economic indicators and forex news events and releases that shape the markets. Indeed, quickly getting a handle on which data to look out for, what it means, and how to trade it can see new traders quickly become far more profitable and sets up the road to long term success.
Top 10 Chart Patterns Every Trader Should Know
Chart patterns are one of the most effective trading tools for a trader. They are pure price-action, and form on the basis of underlying buying and selling pressure. Chart patterns have a proven track-record, and traders use them to identify continuation or reversal signals, to open positions and identify price targets.
7 Ways to Avoid Forex Scams
The forex industry is recently seeing more and more scams. Here are 7 ways to avoid losing your money in such scams: Forex scams are becoming frequent. Michael Greenberg reports on luxurious expenses, including a submarine bought from the money taken from forex traders. Here’s another report of a forex fraud. So, how can we avoid falling in such forex scams?
What Are the 10 Fatal Mistakes Traders Make
Trading is exciting. Trading is hard. Trading is extremely hard. Some say that it takes more than 10,000 hours to master. Others believe that trading is the way to quick riches. They might be both wrong. What is important to know that no matter how experienced you are, mistakes will be part of the trading process.
The challenge: Timing the market and trader psychology
Successful trading often comes down to timing – entering and exiting trades at the right moments. Yet timing the market is notoriously difficult, largely because human psychology can derail even the best plans. Two powerful emotions in particular – fear and greed – tend to drive trading decisions off course.