In my first article on Point and Figure (P&F) charting, I discussed the basics of creating that style of chart. In this article, I will build upon that knowledge and show more advanced methods for identifying patterns and projecting price movement. I want to mention that I tend to use this method of charting for longer term swing or position trades rather than intraday. Remember that time is not a factor while attempting to achieve targets in P&F and you will likely hold positions for some time.
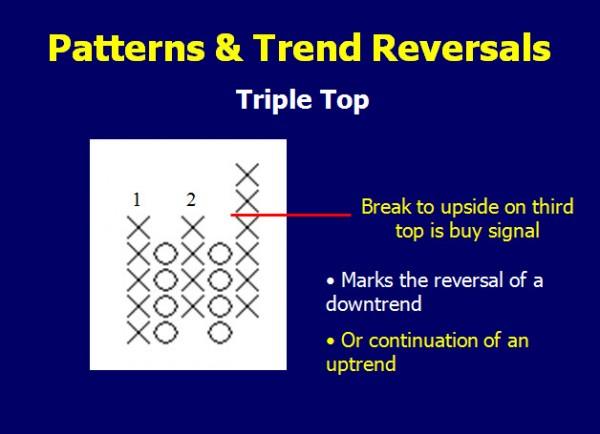
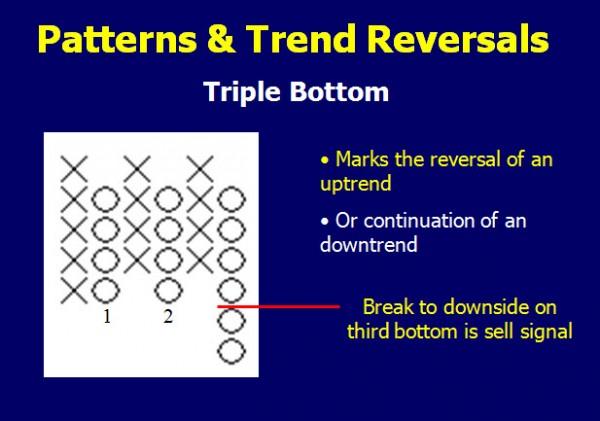
Patterns in P&F charts are a bit different than what you may be used to in candlestick charting. A triple top formation is not necessarily a reversal formation, it could be continuation. It will still offer a trading opportunity however. Look at the following examples of both the bullish and bearish triple formation.
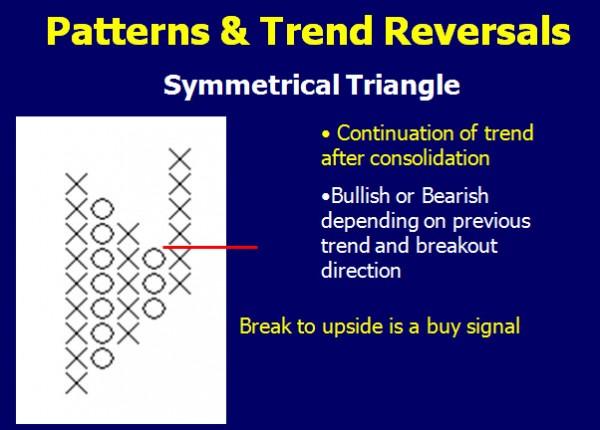
Even patterns such as triangles are visible and tradable on P&F charts. They will work in much the same manner as they would on candlestick charts.
In the previous article, ”Point and Figure,” I discussed the use of horizontal price projections.
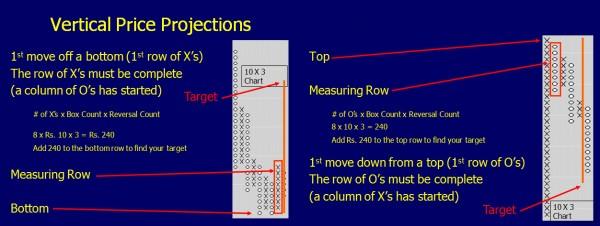
Many traders choose a different price projection method. If you are not using a 1 box reversal chart and have instead selected a three box, (this refers to how much price would have to reverse for you to start a new column Rs. 10×3 means price would have reversed a minimum of Rs. 30), you can try the vertical price projection method. I have found this style to be more accurate in projecting targets.
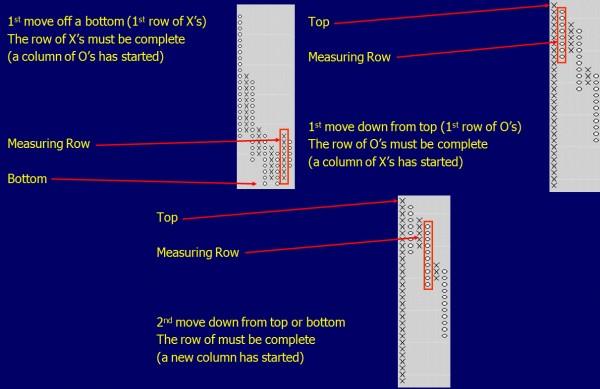
The vertical price projection can only be made under certain circumstances. They are:
-
1st move off a bottom (1st row of X’s)
-
1st move down from top (1st row of O’s)
-
2nd move from top or bottom
Once you have counted the correct column, you can multiply that count by the per box value and then multiply that number by the size for reversal. Your result should then be added to either the price bottom or subtracted from the price top to give you the price projection.
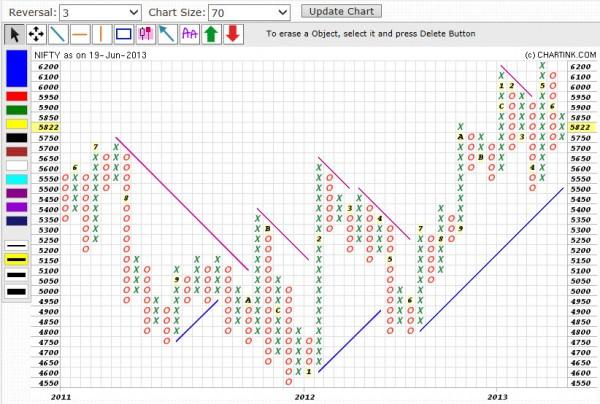
Now that we know the basics and what to look for, let’s examine a few P&F charts to see this technique in action. I have a chart of the Nifty in a 70×3 point and figure format. The 70 means I need a minimum of a 70 point move between closing prices to make a new box of X’s or O’s. I must also have a minimum of 210 points (70×3), to start a new column for a reversal. The numbers and letters refer to the months (1-9 are Jan. to Sept., A-C are Oct. to Dec.)
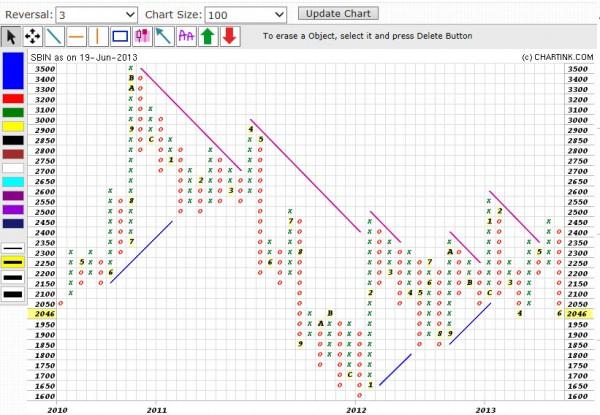
I can do the same with charts of individual stocks. I can adjust the box size on the chart for stocks or the indexes due to their higher or lower prices.
If you are looking for smaller duration trades, you can lessen the box size and also the closing periods. I had been using the daily closes on the previous charts. Depending on the trading software that you use, you can set box size smaller. This makes the chart more sensitive and allows me to see intraday activity. I can set the chart’s period to five minutes. If the close from a five minute period would cause a change in the chart, it is noted instead of waiting for the daily close.
By adjusting the box size and even what closing price the box will use, you can create all types of interesting charts to follow trends in the intraday or even multi decade trend following charts. The possibilities are limitless. Next week we will examine more strategies on point and figure charts and how to use them in conjunction with our core strategy of supply and demand.
Neither Freedom Management Partners nor any of its personnel are registered broker-dealers or investment advisers. I will mention that I consider certain securities or positions to be good candidates for the types of strategies we are discussing or illustrating. Because I consider the securities or positions appropriate to the discussion or for illustration purposes does not mean that I am telling you to trade the strategies or securities. Keep in mind that we are not providing you with recommendations or personalized advice about your trading activities. The information we are providing is not tailored to any individual. Any mention of a particular security is not a recommendation to buy, sell, or hold that or any other security or a suggestion that it is suitable for any specific person. Keep in mind that all trading involves a risk of loss, and this will always be the situation, regardless of whether we are discussing strategies that are intended to limit risk. Also, Freedom Management Partners’ personnel are not subject to trading restrictions. I and others at Freedom Management Partners could have a position in a security or initiate a position in a security at any time.
Editors’ Picks

EUR/USD plummets to 1.1840 on US NFP
EUR/USD’s selling momentum now picks up pace and rapidly hits the 1.1840 region on Wednesday. Indeed, the pair’s decline comes amid rising buying pressure on the US Dollar in the wake of firmer-than-expected results from US NFP in January.

GBP/USD approaches 1.3600 on USD-buying
GBP/USD adds to Tuesday’s pullback and trades closer to the 1.3600 support on Wednesday. That said, Cable’s extra downside traction comes against the backdrop of renewed strength in the Greenback as investors assess the latest US NFP data.

Gold trims gains post-NFP, targets $5,000
Gold rapidly reverses initial gains and retreats to the vicinity of the $5,000 region per troy ounce amid further gains in the Greenback and rising US Treasury yields, all following the latest US NFP readings.

Ripple Price Forecast: XRP sell-side pressure intensifies despite surge in addresses transacting on-chain
Ripple (XRP) is edging lower around $1.36 at the time of writing on Wednesday, weighed down by low retail interest and macroeconomic uncertainty, which is accelerating risk-off sentiment.

US jobs data surprises to the upside, boosts stocks but pushes back Fed rate cut expectations
This was an unusual payrolls report for two reasons. Firstly, because it was released on Wednesday, and secondly, because it included the 2025 revisions alongside the January NFP figure.
RECOMMENDED LESSONS
Making money in forex is easy if you know how the bankers trade!
I’m often mystified in my educational forex articles why so many traders struggle to make consistent money out of forex trading. The answer has more to do with what they don’t know than what they do know. After working in investment banks for 20 years many of which were as a Chief trader its second knowledge how to extract cash out of the market.
5 Forex News Events You Need To Know
In the fast moving world of currency markets where huge moves can seemingly come from nowhere, it is extremely important for new traders to learn about the various economic indicators and forex news events and releases that shape the markets. Indeed, quickly getting a handle on which data to look out for, what it means, and how to trade it can see new traders quickly become far more profitable and sets up the road to long term success.
Top 10 Chart Patterns Every Trader Should Know
Chart patterns are one of the most effective trading tools for a trader. They are pure price-action, and form on the basis of underlying buying and selling pressure. Chart patterns have a proven track-record, and traders use them to identify continuation or reversal signals, to open positions and identify price targets.
7 Ways to Avoid Forex Scams
The forex industry is recently seeing more and more scams. Here are 7 ways to avoid losing your money in such scams: Forex scams are becoming frequent. Michael Greenberg reports on luxurious expenses, including a submarine bought from the money taken from forex traders. Here’s another report of a forex fraud. So, how can we avoid falling in such forex scams?
What Are the 10 Fatal Mistakes Traders Make
Trading is exciting. Trading is hard. Trading is extremely hard. Some say that it takes more than 10,000 hours to master. Others believe that trading is the way to quick riches. They might be both wrong. What is important to know that no matter how experienced you are, mistakes will be part of the trading process.
The challenge: Timing the market and trader psychology
Successful trading often comes down to timing – entering and exiting trades at the right moments. Yet timing the market is notoriously difficult, largely because human psychology can derail even the best plans. Two powerful emotions in particular – fear and greed – tend to drive trading decisions off course.
