What do you do at an intersection?

Hello traders! In last week's Lessons From the Pros newsletter, we discussed how learning to trade is like learning to drive a car - Learning to Trade is Like Learning to Drive. This week we will continue the driving theme while we look at charts to help us determine high probability/low risk trades.
When you pull up to an intersection, very often we have a couple of choices to make be it to turn left, right, or go straight. In trading, our choices are buy, sell or wait. In the following EURUSD chart, we have an intersection of a previous demand/supply zone and a pair of trendlines. When we come to this intersection, what is the higher probability trade, long or short?
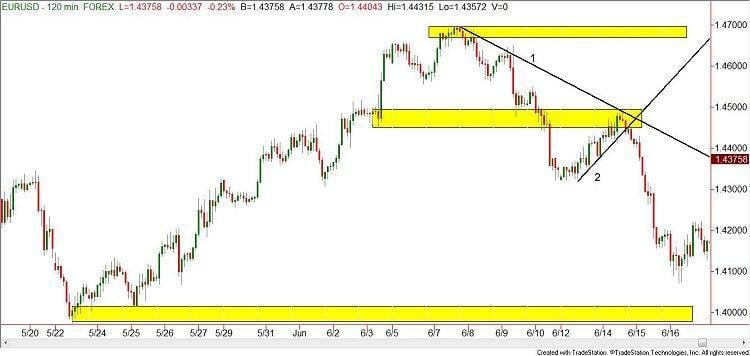
While we are in this yellow shaded supply and demand zone near the intersection of the two trendlines, we have a choice to make. Go left or right? Long or short? Or should we wait? When I teach one of our Online Trading Academy classes, this question comes up every trading day. If your answer to the buy sell or wait question is "wait," you have to ask yourself the next question. "Wait for what?" In this example, we are waiting to see which trendline is going to win at this intersection/decision point in our trading road. The general rule of thumb is that the trendline that has been valid the longest is the trendline that will win. Looking to the left on our supply demand zone area, there isn't a very compelling or high quality level we would have drawn here. Using the two trendlines and the intersection of all three can give us a trade. In this case, selling in the minor supply zone because of the longer term downward sloping trendline (#1) would have been the proper trade.
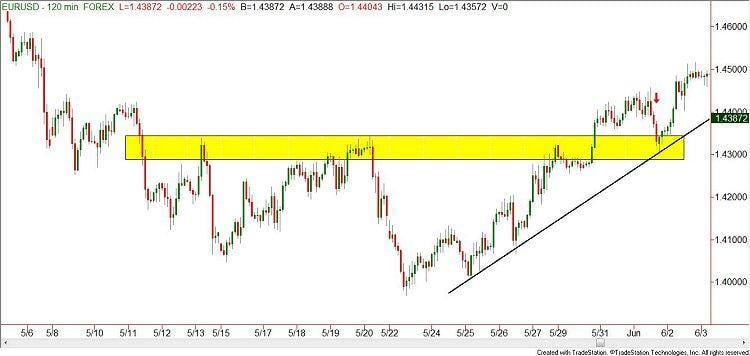
In the following EURUSD chart, we only have an intersection of a trendline and a supply demand zone. As the price action falls quickly into the yellow demand zone near the red arrow, there isn't really a clear downward trendline that we can draw into that zone.
However, the longer term upward sloping trendline is very obvious. Coming into this intersection, we only have two choices, buy or wait. (You could make the case for planning a short trade, but not until the yellow demand zone had been broken or even broken and then re-tested.) Why on earth would you sell IN the yellow demand zone? No reason at this intersection. If price drops through the demand zone, there would be a potential sell. But at this time, the better choice is to hit the buy button. If your answer to the question buy, sell or wait was to wait, what on earth are you waiting for? A traffic cop to point at you and tell you to go? I hope you don't need that!
Let's explore this topic a bit more. Leaving our driving analogies for a moment, what kind of trades are these - reversal or trend – following? Most people will answer trend - following. Guess what? Every trade is BOTH. On these two charts they are obvious trend followers, but when you zoom in on a smaller time frame –for example a 10 minute chart-you will notice very often a reversal trade.
What are we looking for in a reversal trade? Usually, some type of reversal pattern like a double top/bottom, head and shoulders, etc. The plan of action is then to do the following: In a larger time frame chart, look for an intersection of a trendline (or two!) and a supply demand zone. Look for a smaller time frame reversal pattern in the intersection. This should give you the direction to trade with a higher probability of being right.
Practice this technique like you practiced driving, and make sure you look both ways before turning!
Author

Rick Wright
Online Trading Academy
Rick studied economics and psychology at Iowa State University, and entered into the brokerage business in 1992. He earned the NASD Series 4,7,9,10,24,55,63, and 65 licenses. He helped grow an online brokerage business which was eventually sold off.


