![]() Brandon Wendell, CMT
Brandon Wendell, CMT
Brandon Wendell
OTA’s professional instructors are here to help you realize your full trading potential. As a student, you owe it to yourself to USE that resource. If you are not yet a student of Online Trading Academy, visit your local center to see what our professional traders/instructors can do to help you reach your peak trading or investing potential.
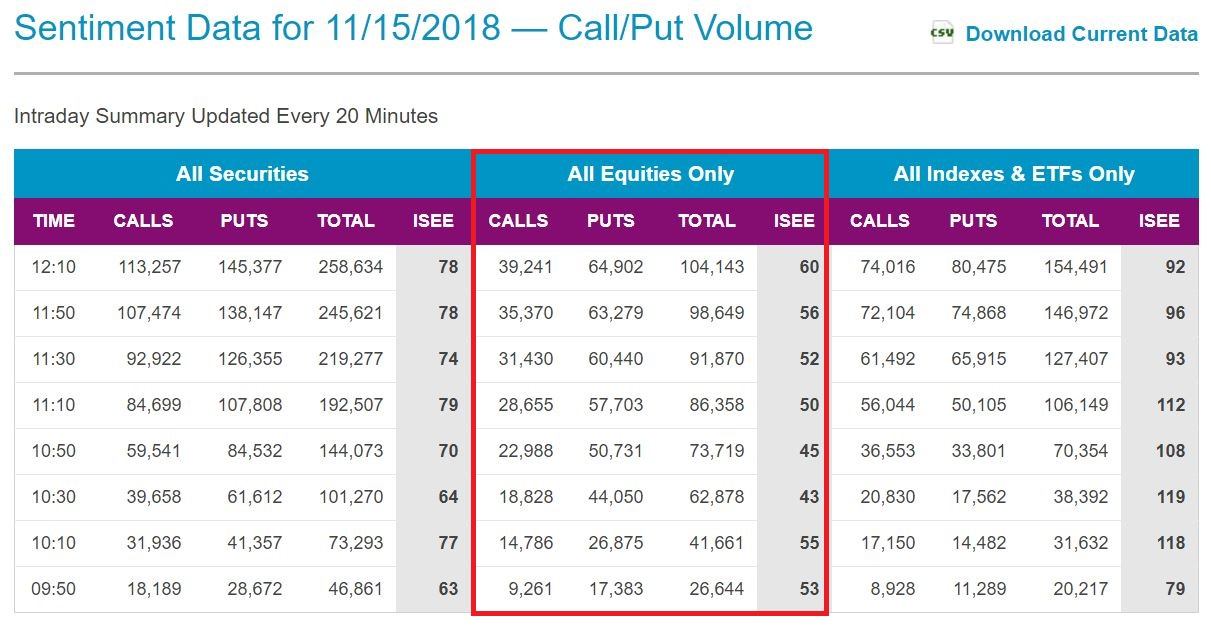
There are also many tools that can be utilized in conjunction with Core Strategy to increase your odds for success. One such tool is the ISE Sentiment Index (ISEE) that is now available on the Nasdaq website.
The ISE Sentiment Index is a sort of Put/Call Ratio with a twist. The Put/Call ratio has long been used as a sentiment indicator to gauge whether investors and traders were becoming too bullish or bearish on the markets. If too many people were buying puts over calls, then the stock may be oversold and poised for a bounce. The ISEE goes a step further and only counts NEW put and call positions being opened by small investors and traders. It ignores currently open positions to find the current sentiment in real time. The ISEE also filters out institutional positions so the data does not become skewed by them hedging positions instead of taking advantage of potential market moves. Remember, an institution buying puts may not be bearish as they may want to protect a major long position or may even sell calls to reduce cost basis.
The majority of dumb money, which includes small investors, traders, and people we know of as the herd, are usually wrong at timing major turning points. We can use the ISEE to determine when the bullish or bearish dumb money sentiment has become so great that the market may be at a turning point. If the ISEE closes at an extreme level, it usually marks a reversal point in the market. Remember, the reversal may not be immediate, the move usually occurs shortly after the extreme unless prevented by Fed actions, major news effecting the market, or acts of terrorism.
In order to read the ISEE, you will to the Nasdaq website, scroll down to the ISEE Index Chart and choose All Equities Only from the View dropdown menu.
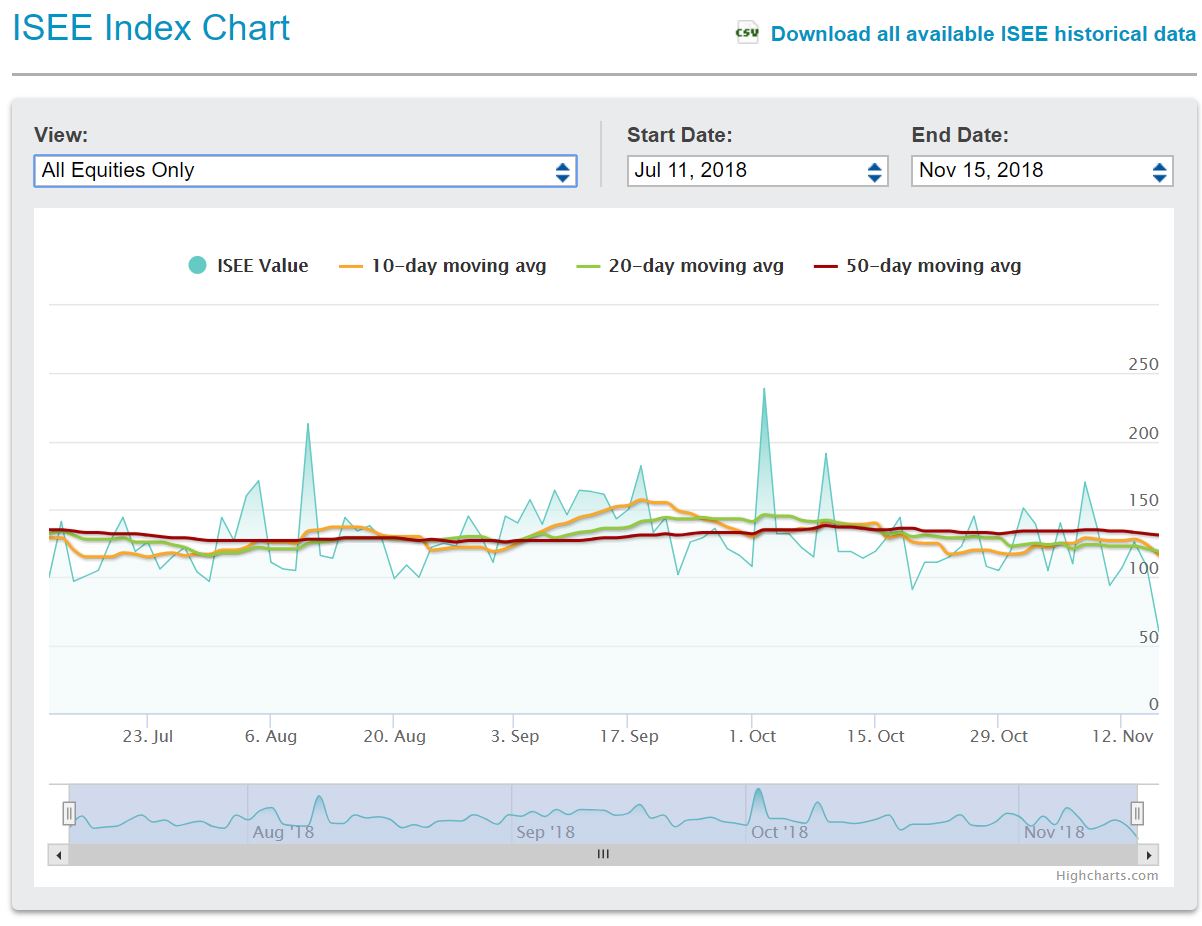
The low level sentiment reading is a close below 100. Remember, the intraday data is nice, but the closing value is the most important. If you see a close below 100, expect a broad market rally. The high sentiment reading is 200. If you see the closing value on a given day is over 200, expect a sell-off in the markets. That’s it! Pretty simple isn’t it?
Well, those are the basics but there are some related articles on how to use the indicator in a more advanced manner on the ISE website. You can also go to the Market Data and Trading Tools tab on the left of the site and see more information on the ISEE. You can even get a chart of the index including moving averages.
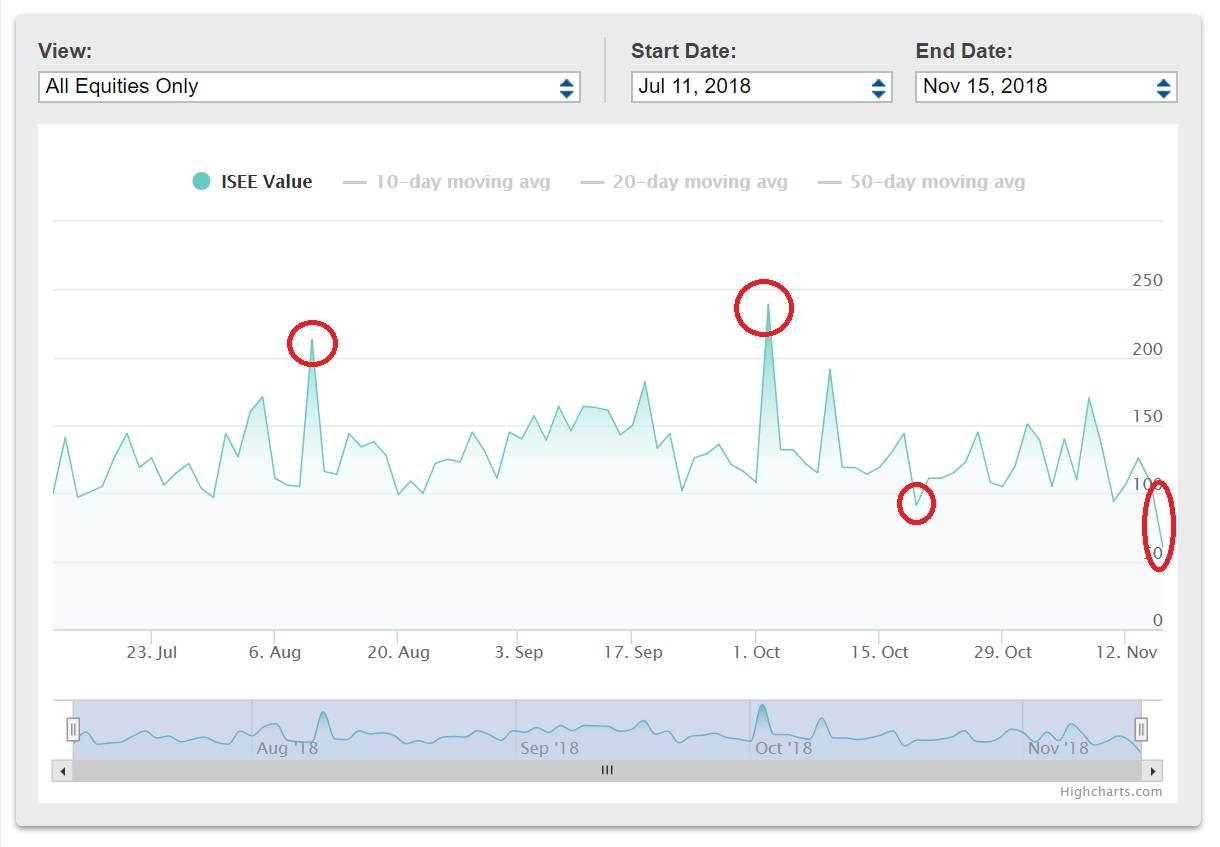
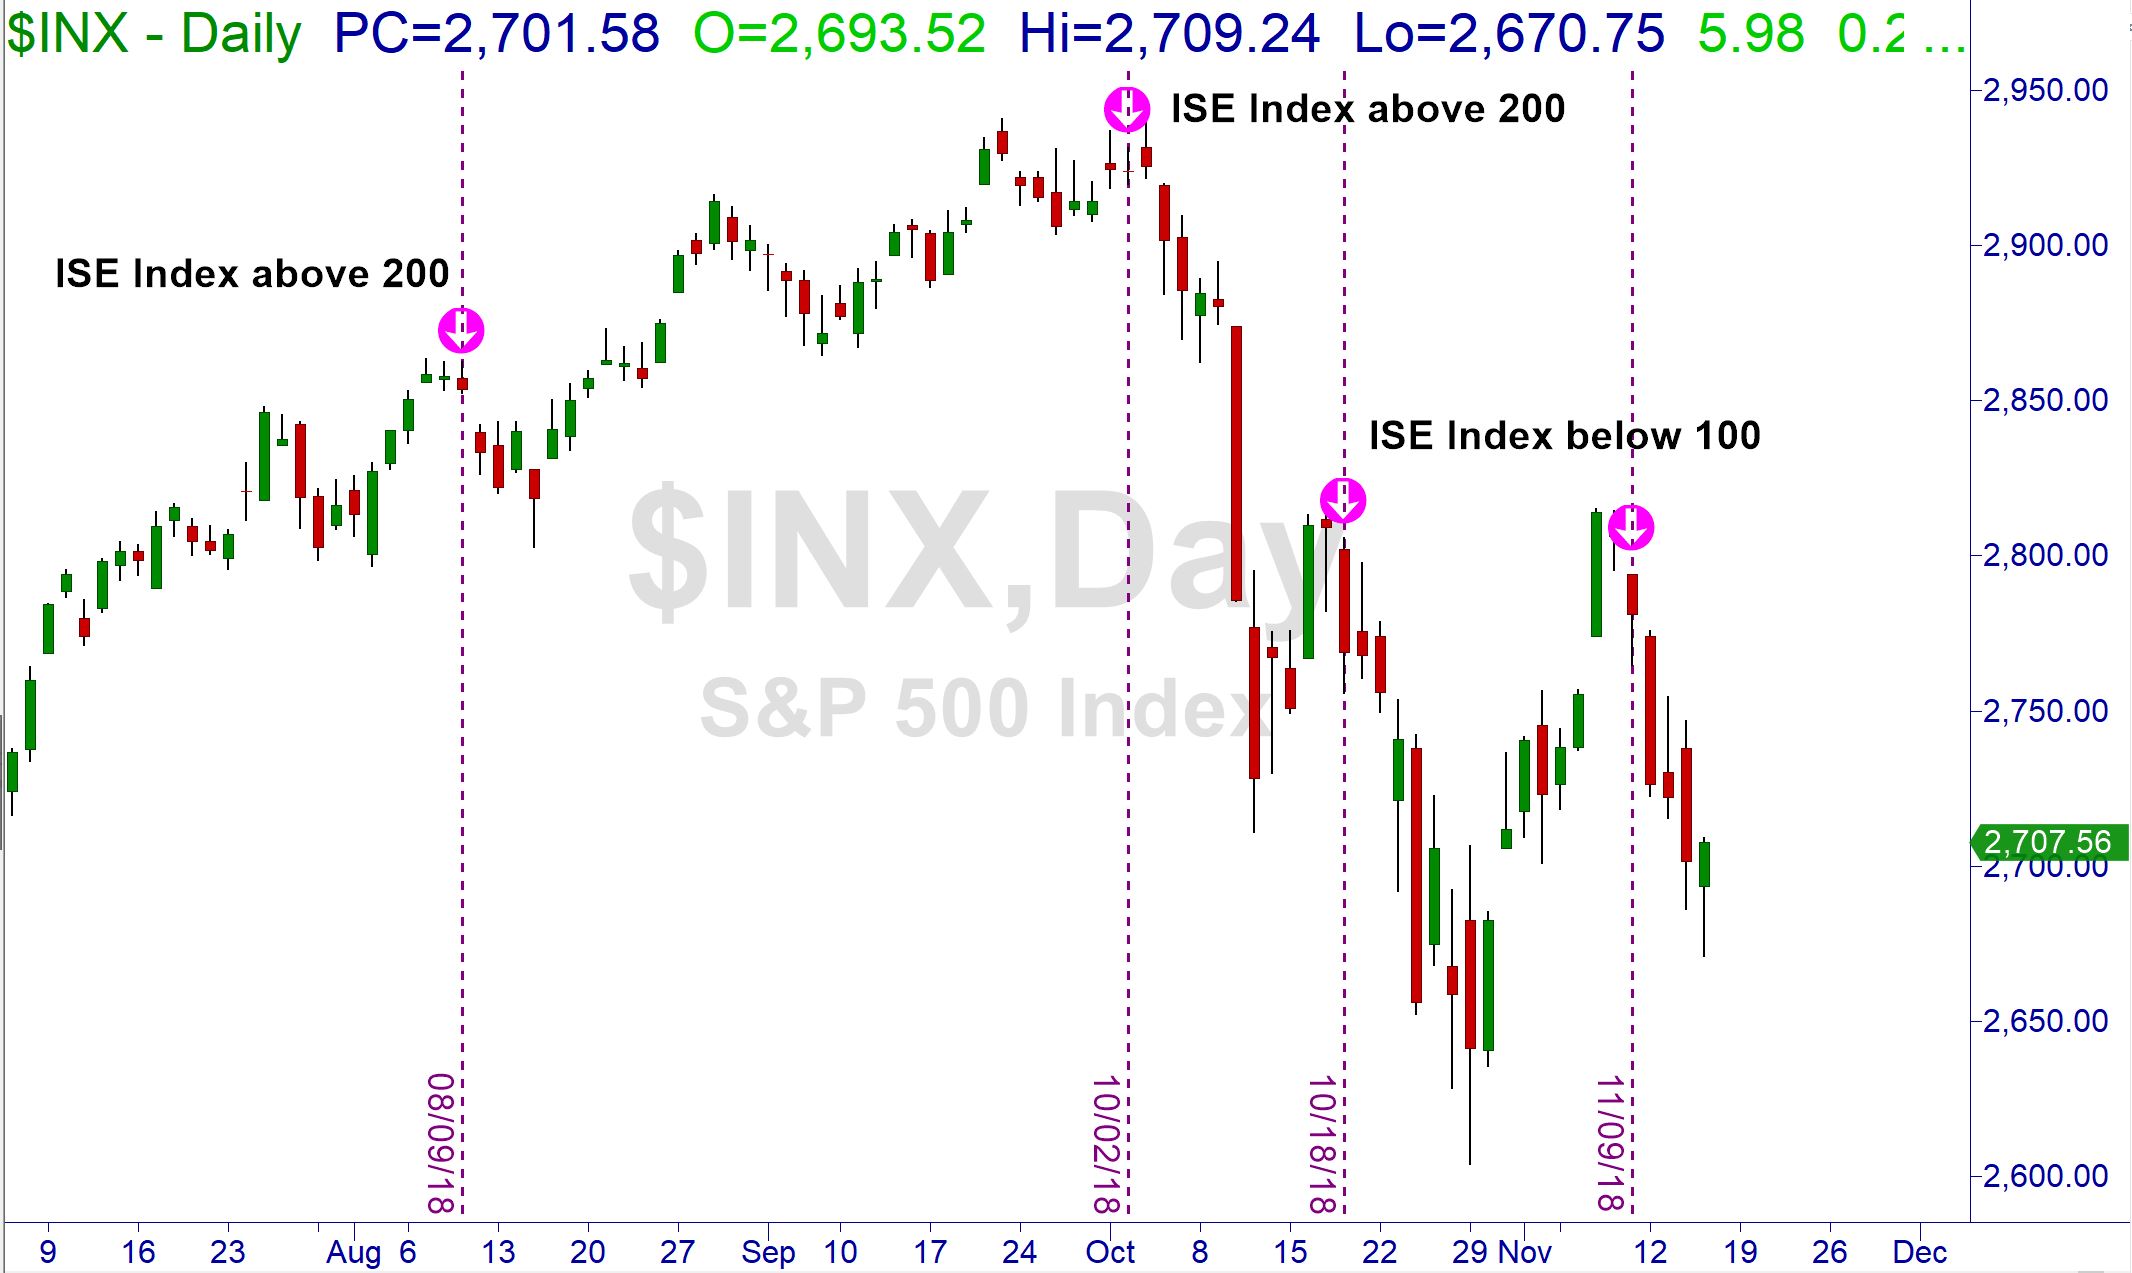
On the chart above, I highlighted the most recent closes below 100 and above 200. Let’s examine what happened with the S&P 500 after these extremes on the chart below.
What did the market do after that close? Looking at the following chart of the S&P 500 we see that the markets recently sold off on extreme readings on both sides. This is a bit unusual as normally a reading below 100 would precede a rally.
I hope you enjoyed learning about this indicator and please contact any of our excellent instructors at Online Trading Academy if you have further questions or need assistance in becoming the best trader you can be. Until next time, may all of your trades be green and your losses small!
Read the original article here - ISEing your Odds
Neither Freedom Management Partners nor any of its personnel are registered broker-dealers or investment advisers. I will mention that I consider certain securities or positions to be good candidates for the types of strategies we are discussing or illustrating. Because I consider the securities or positions appropriate to the discussion or for illustration purposes does not mean that I am telling you to trade the strategies or securities. Keep in mind that we are not providing you with recommendations or personalized advice about your trading activities. The information we are providing is not tailored to any individual. Any mention of a particular security is not a recommendation to buy, sell, or hold that or any other security or a suggestion that it is suitable for any specific person. Keep in mind that all trading involves a risk of loss, and this will always be the situation, regardless of whether we are discussing strategies that are intended to limit risk. Also, Freedom Management Partners’ personnel are not subject to trading restrictions. I and others at Freedom Management Partners could have a position in a security or initiate a position in a security at any time.
Editors’ Picks

EUR/USD hits two-day highs near 1.1820
EUR/USD picks up pace and reaches two-day tops around 1.1820 at the end of the week. The pair’s move higher comes on the back of renewed weakness in the US Dollar amid growing talk that the Fed could deliver an interest rate cut as early as March. On the docket, the flash US Consumer Sentiment improves to 57.3 in February.

GBP/USD reclaims 1.3600 and above
GBP/USD reverses two straight days of losses, surpassing the key 1.3600 yardstick on Friday. Cable’s rebound comes as the Greenback slips away from two-week highs in response to some profit-taking mood and speculation of Fed rate cuts. In addition, hawkish comments from the BoE’s Pill are also collaborating with the quid’s improvement.

USD/JPY drops back below 157.00, as focus shifts to Japan snap election
USD/JPY is back in the red below 157.00 in the Asian session on Friday. The Japanese Yen recovers ground against the US Dollar amid some profit-taking ahead of Japan's snap general election on Sunday. The preliminary reading of the Michigan Consumer Sentiment Index report for February will be released later on Friday.
Editors’ Picks

EUR/USD: US Dollar to remain pressured until uncertainty fog dissipates Premium
The EUR/USD pair lost additional ground in the first week of February, settling at around 1.1820. The reversal lost momentum after the pair peaked at 1.2082 in January, its highest since mid-2021.

Gold: Volatility persists in commodity space Premium
After losing more than 8% to end the previous week, Gold (XAU/USD) remained under heavy selling pressure on Monday and dropped toward $4,400. Although XAU/USD staged a decisive rebound afterward, it failed to stabilize above $5,000.

GBP/USD: Pound Sterling tests key support ahead of a big week Premium
The Pound Sterling (GBP) changed course against the US Dollar (USD), with GBP/USD giving up nearly 200 pips in a dramatic correction.

Bitcoin: The worst may be behind us
Bitcoin (BTC) price recovers slightly, trading at $65,000 at the time of writing on Friday, after reaching a low of $60,000 during the early Asian trading session. The Crypto King remained under pressure so far this week, posting three consecutive weeks of losses exceeding 30%.

Three scenarios for Japanese Yen ahead of snap election Premium
The latest polls point to a dominant win for the ruling bloc at the upcoming Japanese snap election. The larger Sanae Takaichi’s mandate, the more investors fear faster implementation of tax cuts and spending plans.
RECOMMENDED LESSONS
Making money in forex is easy if you know how the bankers trade!
I’m often mystified in my educational forex articles why so many traders struggle to make consistent money out of forex trading. The answer has more to do with what they don’t know than what they do know. After working in investment banks for 20 years many of which were as a Chief trader its second knowledge how to extract cash out of the market.
5 Forex News Events You Need To Know
In the fast moving world of currency markets where huge moves can seemingly come from nowhere, it is extremely important for new traders to learn about the various economic indicators and forex news events and releases that shape the markets. Indeed, quickly getting a handle on which data to look out for, what it means, and how to trade it can see new traders quickly become far more profitable and sets up the road to long term success.
Top 10 Chart Patterns Every Trader Should Know
Chart patterns are one of the most effective trading tools for a trader. They are pure price-action, and form on the basis of underlying buying and selling pressure. Chart patterns have a proven track-record, and traders use them to identify continuation or reversal signals, to open positions and identify price targets.
7 Ways to Avoid Forex Scams
The forex industry is recently seeing more and more scams. Here are 7 ways to avoid losing your money in such scams: Forex scams are becoming frequent. Michael Greenberg reports on luxurious expenses, including a submarine bought from the money taken from forex traders. Here’s another report of a forex fraud. So, how can we avoid falling in such forex scams?
What Are the 10 Fatal Mistakes Traders Make
Trading is exciting. Trading is hard. Trading is extremely hard. Some say that it takes more than 10,000 hours to master. Others believe that trading is the way to quick riches. They might be both wrong. What is important to know that no matter how experienced you are, mistakes will be part of the trading process.
The challenge: Timing the market and trader psychology
Successful trading often comes down to timing – entering and exiting trades at the right moments. Yet timing the market is notoriously difficult, largely because human psychology can derail even the best plans. Two powerful emotions in particular – fear and greed – tend to drive trading decisions off course.