Inside Bars – Part Two

In “Inside Bars – Part One” last week we introduced this classic price pattern and discussed some basic uses of it, we now follow on from that piece by exploring some issues to take note of when trading the pattern as well as looking at a further way to trade the pattern…
Points To Consider
Key thing to remember, as with our breakout trading, is that the actual velocity of the breakout signal candle (the candle that closes outside of the Mother candle range) will vary and won’t always be trade-able, so some discretion is needed. If the breakout signal candle closes to far from the range perimeter then it compromises our risk:reward on the trade as price is less likely to run much further. I would much rather avoid a trades that appears less than favorable than take an unnecessary loser for fear of missing out. There is more than enough opportunity in the markets with chasing after sub-par trades so certainly bear that in mind.
Another way that we can look to maximize our chances of success is to look to trade with the trend. As you can see with the EURUSD example above, price was already moving lower before we established our inside bar setup and so with price moving in a downward trend, the highest probability trade would be a break down to the downside whereas if price was moving in a bullish trend and we got an inside bar setup, the highest probability outcome would be a breakout to the upside. Looking to capitalize on the direction of a prevailing trend is a recipe for long-term success and using a really simple yet solid setup such as the inside bar can be a fantastic way to catch entry points into fluid markets.
Trading The Fakeout
In part one we discussed one aspect of trading inside bars that needs to be carefully navigated for success and that was the Fake-out. We identified that if you simply look to trade a break of the Mother candle range without looking for a candle close then you leave yourself open to experience a fake-out whereby price actually reverses and trades back down into the range. However, once you start to become familiar with trading inside bars and understanding the market mechanics at play when they form then you can actually take advantage of the fakeout.
Where we see price trade through one side of the range to test order but reverse and trade back inside the range we can actually take a reversal trade in these circumstances anticipating a proper reversal.
How is this possible?
Remember the order flow dynamic we identified in part one. Order build up on either side of our trading range to keep price hemmed in. However, price starts to build momentum and trades through the range to test orders on a particular side but the momentum is not enough to break through these order and so price reverses. In these instances we can assume that the market has run out of steam and look to profit from the ensuing moves.
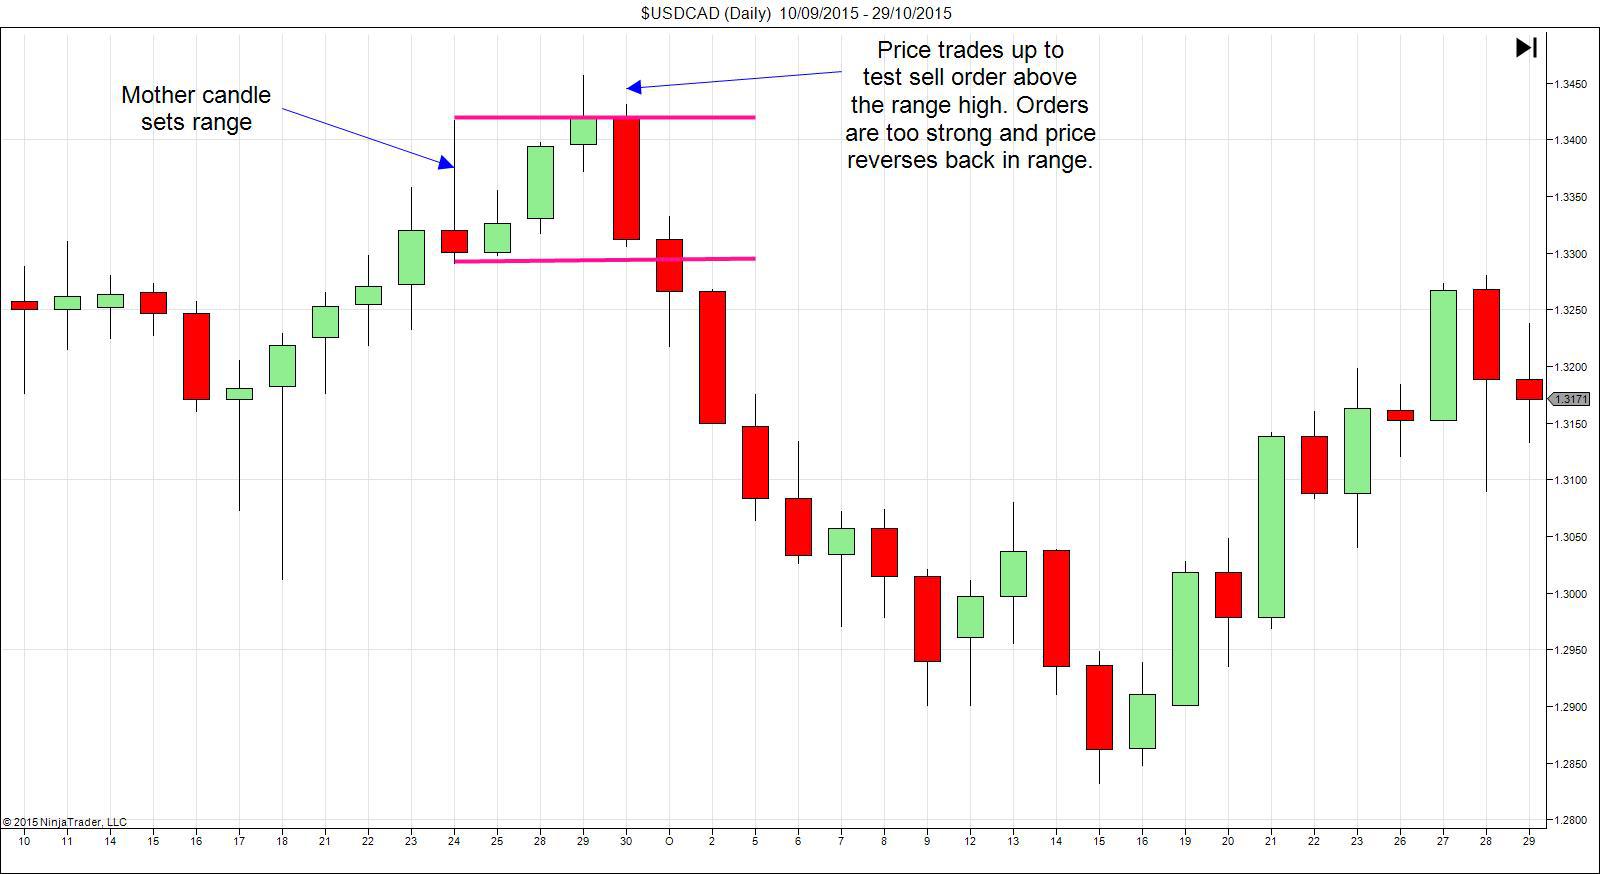
In the above example we can see we have a neat little range of inside bars formed. Price then runs up to pierce the high of the range and test sell orders sitting above the range. Sell order are too strong and buyers run out of steam so price reverses back into the range. We can sell price here anticipating that the weight of sell orders will indeed drive price lower. In these instances we can either target a move back to the other side of the range in a simple range-rotation play or we can hold and anticipate the materialisation of a full break-out through the opposite end of the range. Again as with our traditional inside bar trading, the more inside bars that form the better these trades tend to work out as the build up of orders tend to be much larger.
The beauty of using inside bars, whether trading a traditional breakout play or fading the fake-out is that it is an incredibly simplistic way to capitalise on underlying order flow and can work extremely well on all timeframes. For best results however, I suggest sticking to Daily, H4 & H1 setups as these tend to yield more solid results and where possible, look to trade in line with the overall market trend.
Author

James Harte, IMC
Orbex
James Harte is a Market Analyst and Content Author at Orbex with over eight years’ experience in analysing and trading currency markets.


