Inside Bars – Part One

Price Action Trading
There are a wide range of simple yet effective strategies that we suggest beginner traders try out upon first entering the waters of Forex trading. Among these strategies are various methods and styles incorporating everything from classic indicator trading through to looking at market information and underlying flow, one element that we constantly refer back to is price action.
Simplicity will always serve you best in trading and it really doesn’t get much simpler than price action. The term is banded around a lot by traders and market spectators and often people will be referring to slightly different things, however, at its core, price action trading is simply executing upon the belief that everything you need to know about the market is included right there on there chart in the price action we can see with each candlestick that forms.
Now whilst we don’t necessarily agree completely with this notion, as it’s the underlying order flow that actually drives price action, price can to a certain extent give a decent glimpse into that very underlying order flow and afford us trade-able opportunities. Even within price action trading itself there are a number of different elements to focus upon but for this article we are going to concentrate on one of my favourites; the inside bar.
The Inside Bar
The inside bar or inside candle is an incredibly simple little strategy to work on and can give really great results. Essentially all we are looking for is a candle to form (inside bar) within the high and low of the previous candle (Mother candle). So really the pattern is the opposite of the engulfing candle where we’re looking for a candle to form which completely encapsulates the preceding candle. The inside bar formation looks like this
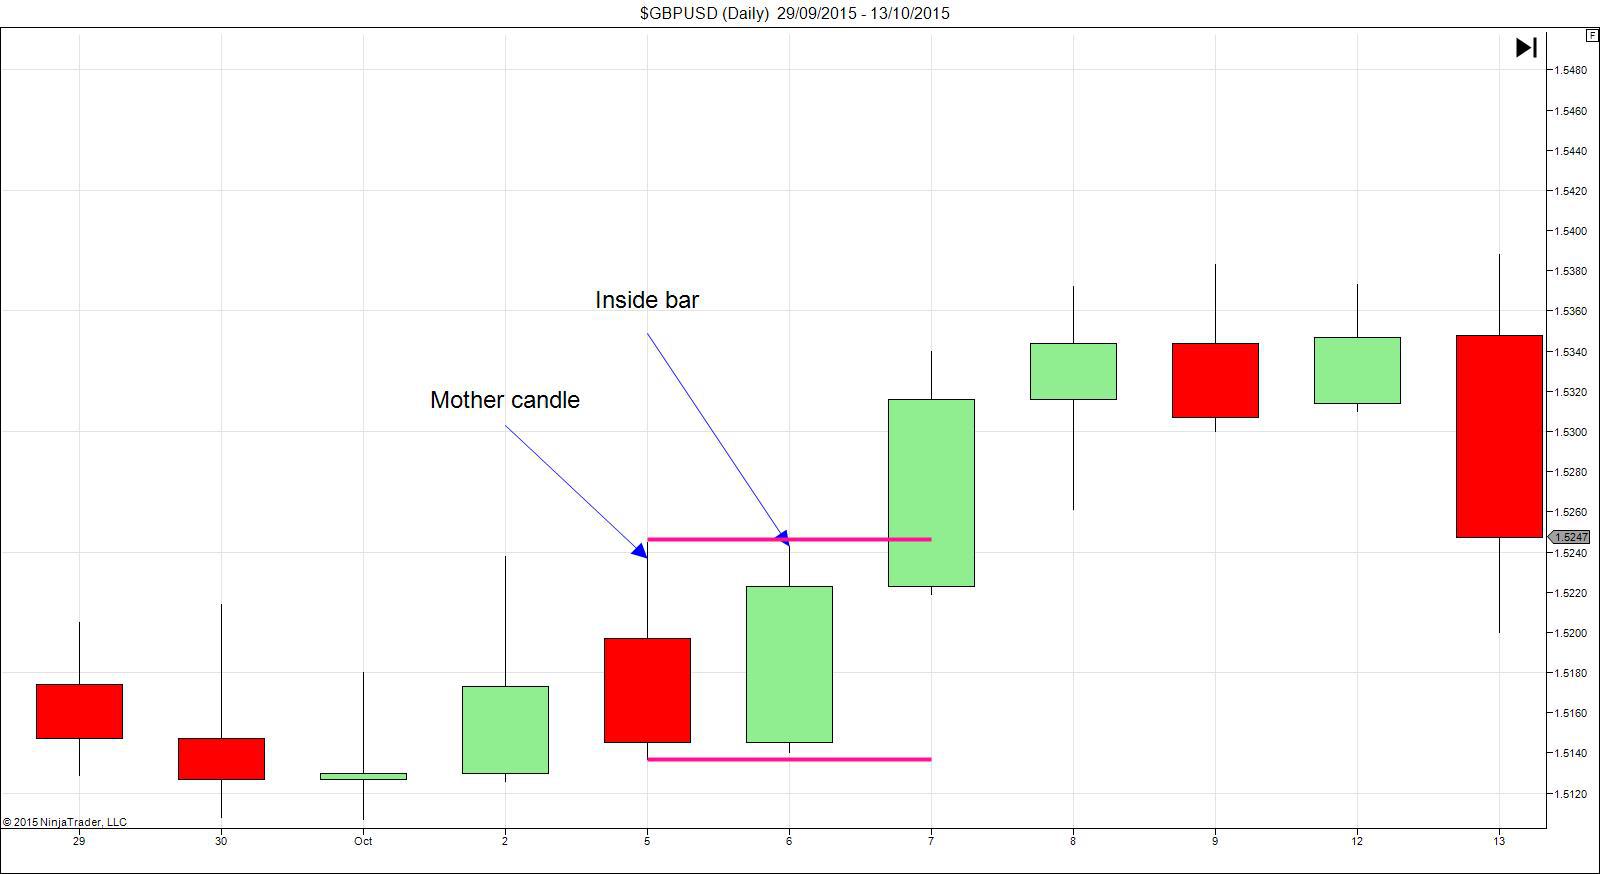
Notice how the bullish candle forms within the upper and lower limits of the preceding candle? this is our inside bar. This formation often occurs before price sustains a breakout and usually the more inside bars that form, the better the breakout as a consequence.
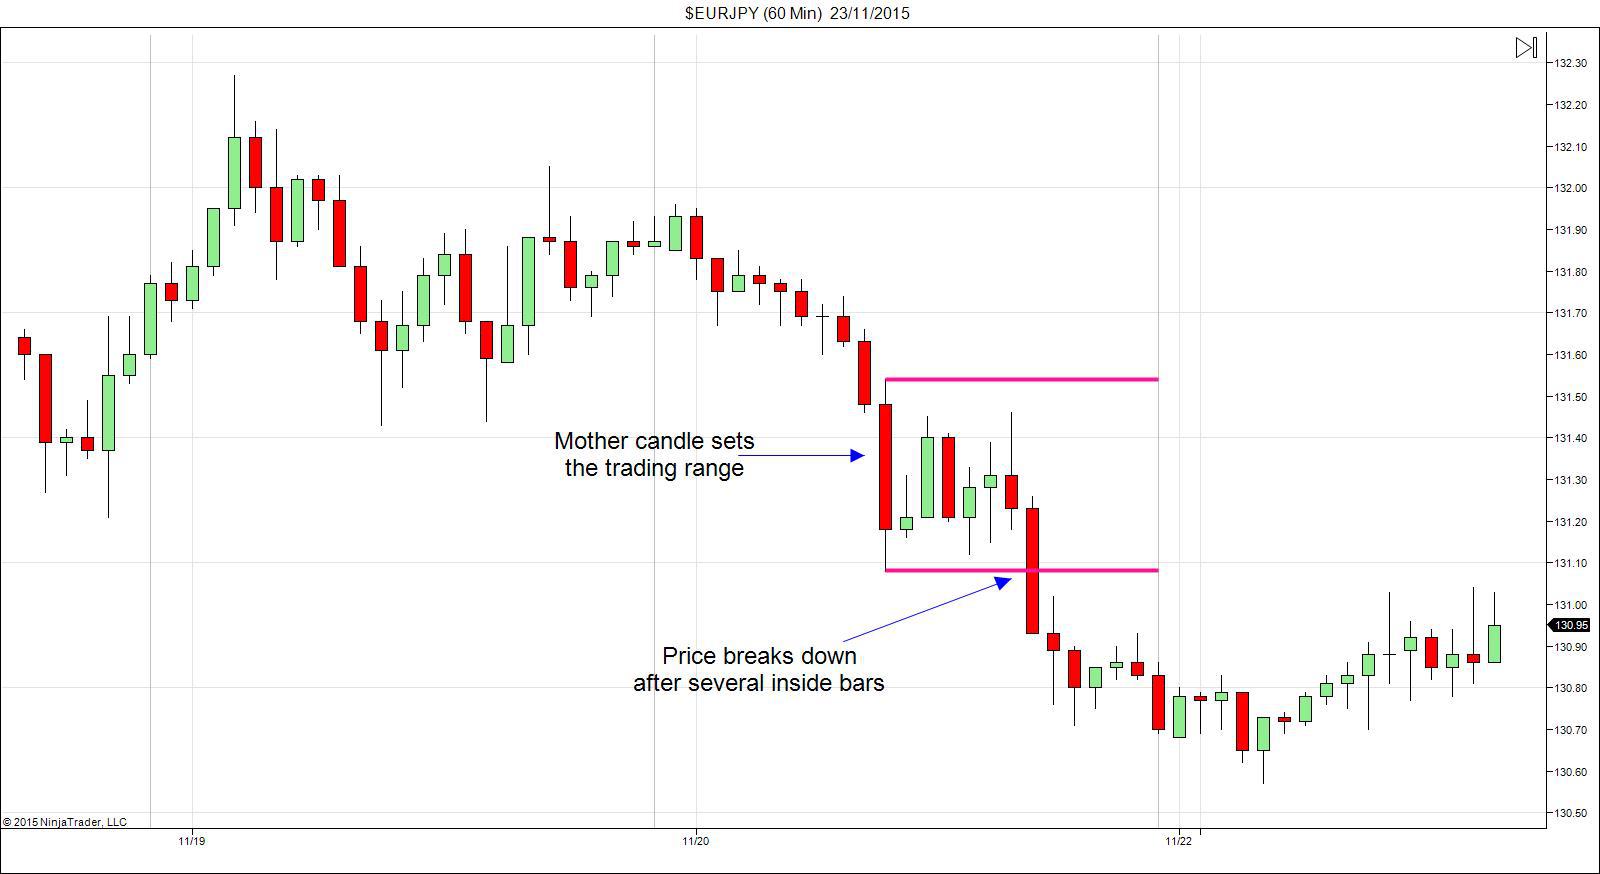
In the example above notice how price forms several inside bars within the range of the Mother candle before price finally breaks down? This is a really great setup to keep an eye out for and can yield really good results. So why does the Inside bar breakout play occur? Well the reason why this specific price action dynamic exists is the same reason behind all of the various price action formations we see: Order Flow.
As price moves into an area of equilibrium and starts to consolidate within a range we tend to get orders building on either side of the range. Eventually one side wins out and we see price breakout, exactly as shown in the examples above. One situation to be wary of however is the fake-out.
Beware The Fake-Out
The fake-out is a situation whereby prices runs through one side of the range set by the Mother candle but doesn’t actually sustain a full breakout and reverses to trade back within the range of the Mother candle. Why does this happen? Price sustains enough momentum to push out and test the orders on one side of the range but not enough to break through them, causing the reversal.
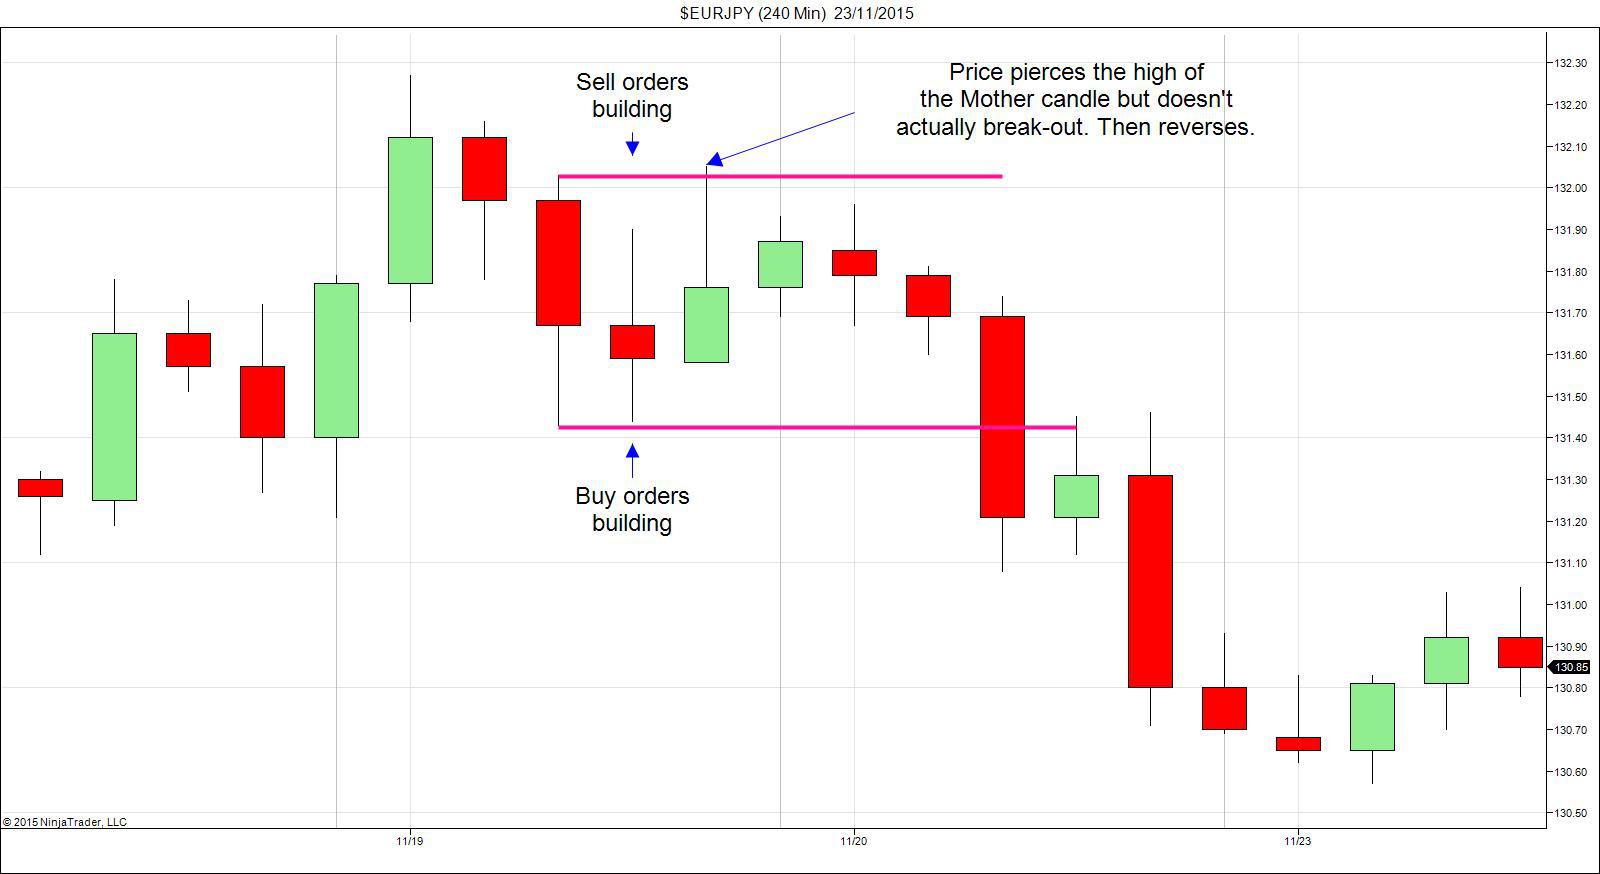
In the example above we have a Mother candle setting our range, we then get a subsequent inside bar confirming our set-up. Price then trades up and tests the sell orders sitting above the range but is unable to break them and indeed reverses back down inside the range. We then get a few more inside candles that show just how pent-up orders are outside the range, before finally price breaks down through the range low erasing buy orders beneath the range.
So for the sake of added confirmation and being more conservative with our trading, we want to wait for a candle close outside of the Mother candle range to trigger a trade, that way we can avoid the dreaded fake-out. Of course, this isn’t to say that waiting for a close will win 100% of the time, because we know that nothing does, but it does greatly reduce the chances of us getting whipsawed!
Trading The Inside Bar Formation
Trading the inside bar formation is essentially just a breakout play and as such as adopt pretty much the same basic strategy that we outline for breakout trading. We look to enter as price breaks the range with a stop 50% the width of the range, targeting at least twice our risk.
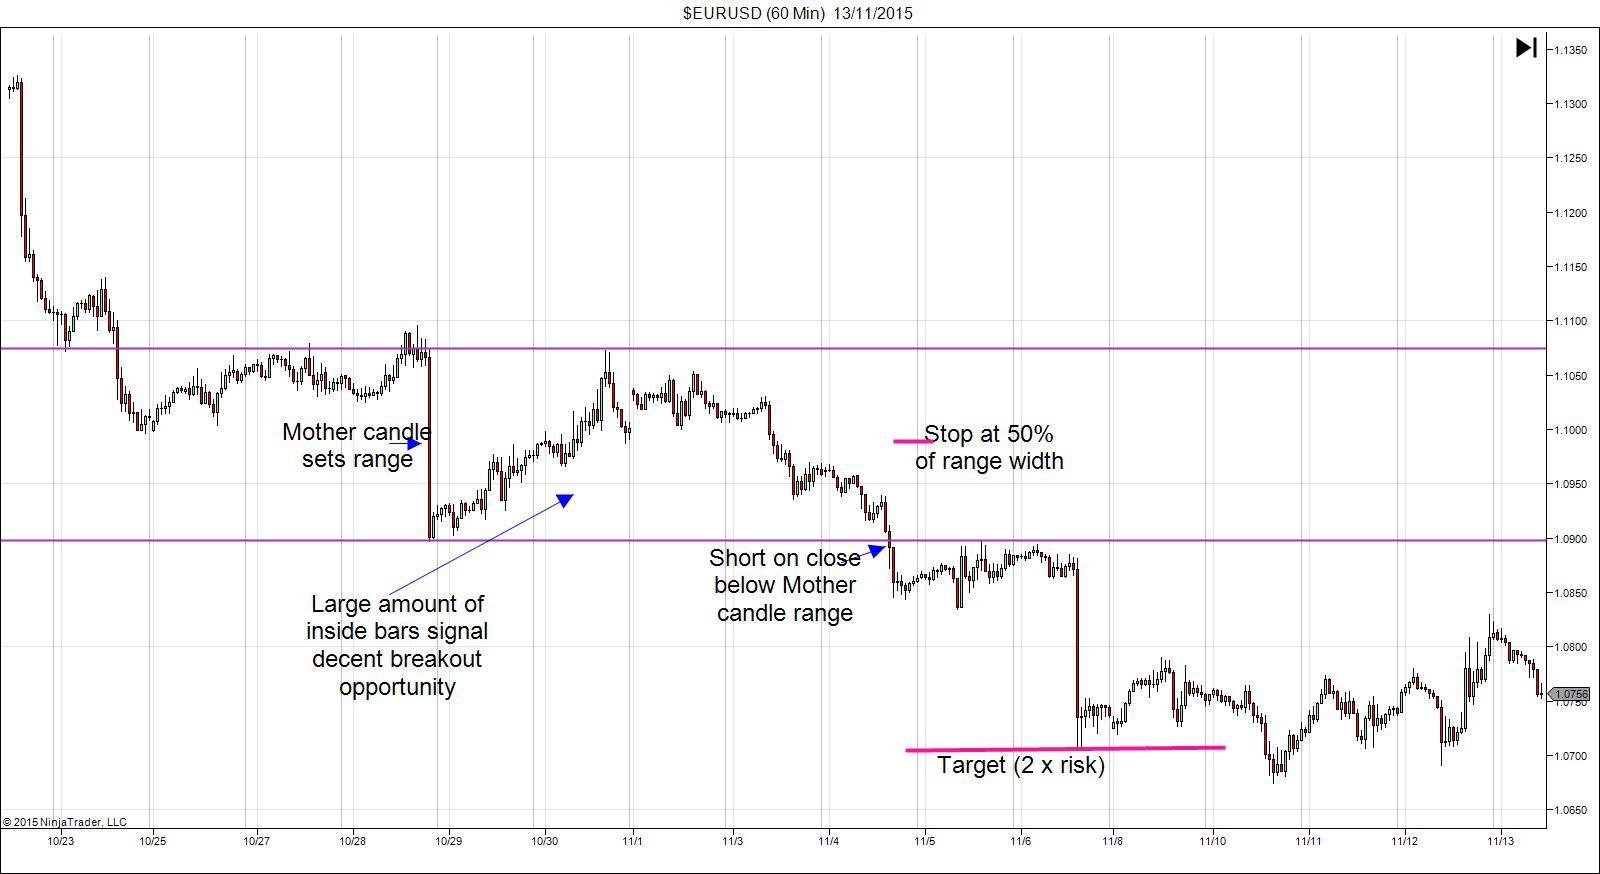
In the example above we have a fantastic example of a recent inside bar setup in EURUSD. As you can see we got a large bearish Mother candle which set the range, which was respected for five days resulting in a large number of inside bars. We then eventually saw price close outside of the range, closing below the lower limit allowing us a short entry. With our stop at 50% of the range width and our target at 2 x risk this would have been a textbook inside bar play.
In part two we will discuss some key points to consider when trading inside bars as well as take a look at some other ways in which you can trade this formation…
Author

Littlefish FX Analysts
Littlefish FX
Our expert team of analysts, traders and IT developers have developed innovative and cutting-edge Order Flow Systems giving Littlefish FX a bank-level view of the Foreign Exchange Market.