Indicators are an excellent way of enhancing your trading strategy. To remind you, in our series of educational articles posted under the SimpleFX CFD Academy we understand trading strategy as a set of heuristics for efficient entries and exits.

First of all, no indicator works well for every trader, every asset and every timeframe. Most of them don't work. You need to practice a lot to find the right mix that works for you.

In this post, I will explain what RSI is and how it can be used as a confirmation indicator.

Is it oversold or overbought?

The Relative Strength Index is 40 years old as it was first introduced by American mechanical engineer and real estate developer J. Welles Wilder Jr. in 1978.

It’s quite straightforward. The indicator oscillates between 0 and 100. When it goes above 70, it means that an asset is overbought and when it goes below 30 - it’s supposed to be a sign its oversold.

RSI can give you information about the trend. If it's below 30, you could consider buying the security, and if it’s over 70, it may be the time to take a short position. During strong trends, RSI can stay above 70 or below 30 for a longer time.

During a bull's market, the RSI usually oscillates between 40 and 90, and when it reaches 40-50, it defines the support level. On the other hand, when the bears take over the indicator oscillates between 10 and 60 with 50-60 mark indicating the resistance level.

Failure Swing Top and Failure Swing Bottom

Now, let's move to some RSI-related nuances. If an asset goes to a new high or falls to a new low, and an RSI hasn't confirmed the price movements during that time frame, this is often considered to be a trading signal for reversal.

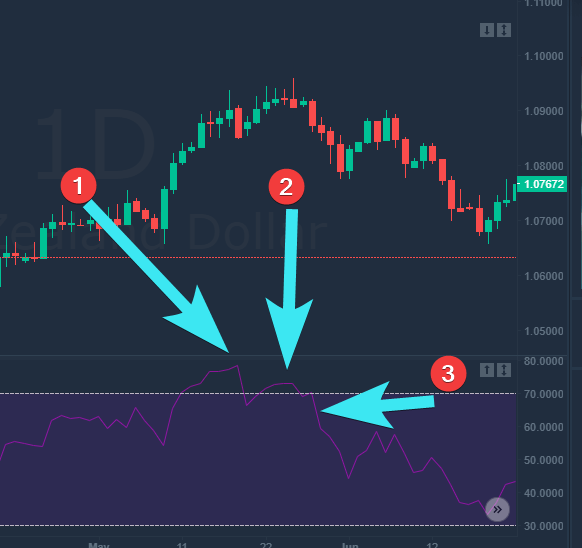
The RSI also has its version of double tops and double bottoms. Just take a look at the AUDNZD 1D chart below.  If a local high (1) was not exceeded and is followed by a lower high (2), it's a good idea to take a short position at the point then RSI falls below the local low (3). This is called Failure Swing Top. A reverse situation is called a Failure Swing Bottom.


That's it from a practical point of view. The RSI signals appear when the indicator goes over 70 levels or under a 30 level. In the oversold levels, you may consider opening a BUY order, and in the overbought levels, you may consider opening a SELL order.

Now, let's take a look at AUDNZD in the last months. The RSI gave no strong signals in this period. However, it moved over 70 in April staying in "oversold" territory for a while.


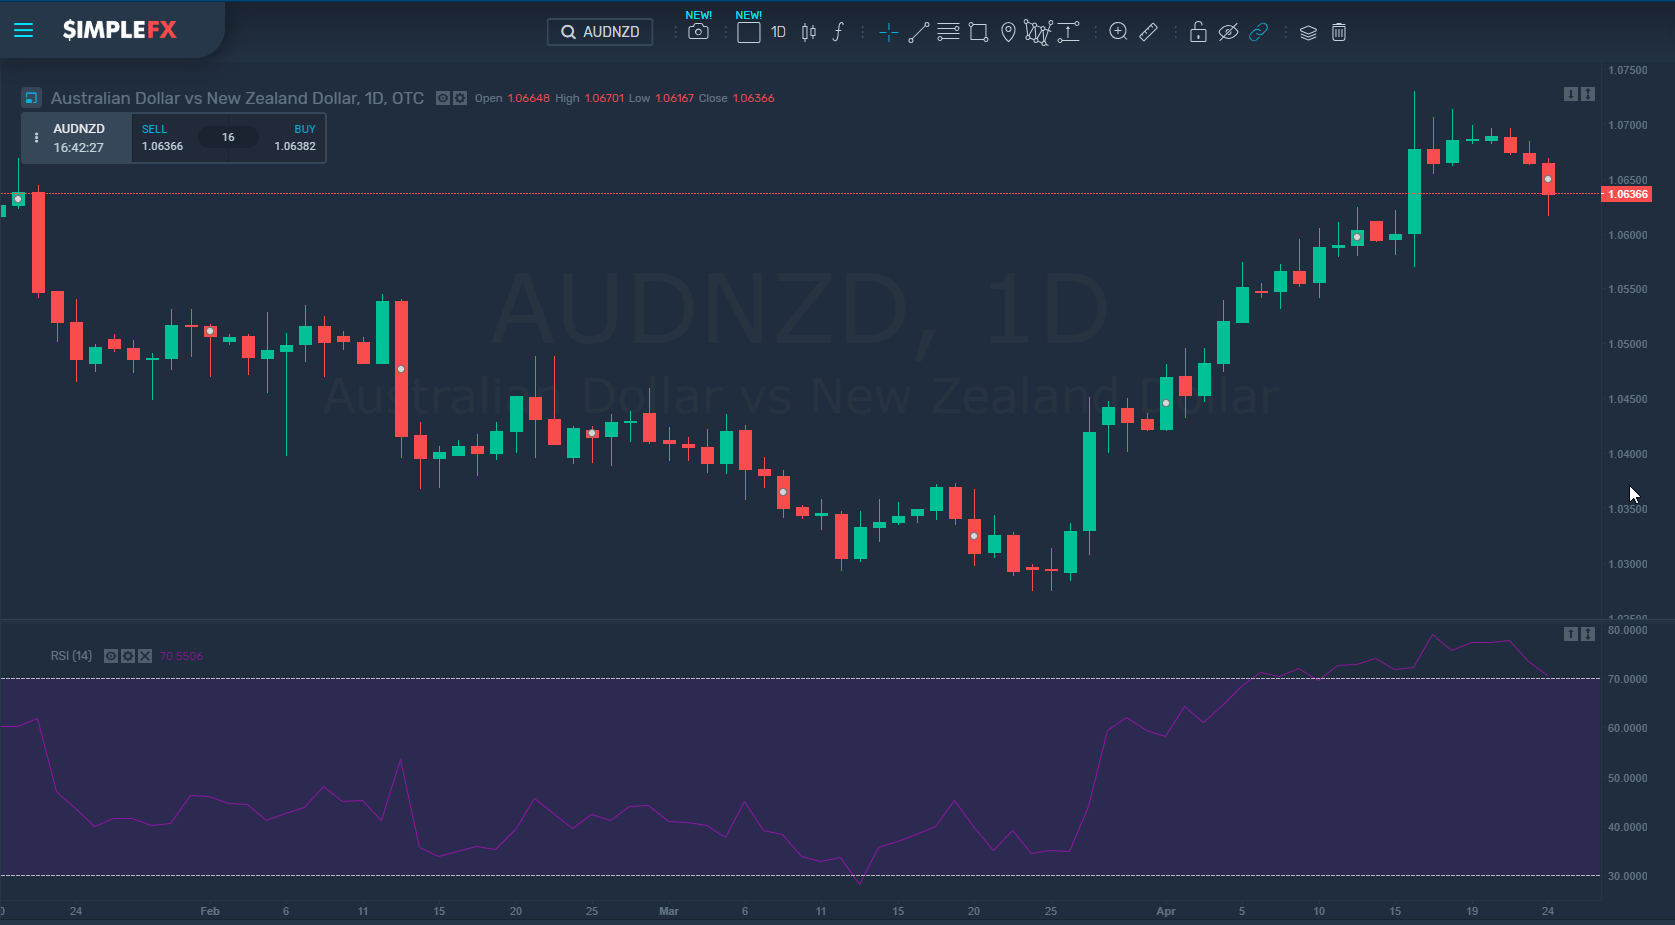
For those of you, who would like to learn how it works with this Forex pair, I’d recommend following the AUDNZD in the next days with the RSI indicator turned on.

Good luck trading!


Advertisement
How to trade with RSI on SimpleFX


Trading in the products and services of SimpleFX may result in losses as well as profits. In particular trading in leveraged products, such as but not limited to, cryptocurrency, foreign exchange, derivatives and commodities can be very speculative. Losses and profits may fluctuate both violently and rapidly.

Editors’ Picks

EUR/USD flirts with 1.0500 on mixed US PMI readings

EUR/USD flirts with 1.0500 on mixed US PMI readings

 The bullish momentum remains unchanged around EUR/USD on Friday as the pair keeps its trade close to the area of multi-week highs around the 1.0500 barrier in the wake of the release of mixed results from the preliminary US Manufacturing and Services PMIs for the current month. 

EUR/USD News
GBP/USD challenges recent peaks near 1.2450

GBP/USD challenges recent peaks near 1.2450

GBP/USD pushes harder and puts the area of recent two-week highs near 1.2450 to the test on the back of the intense sell-off in the Greenback, while the British pound also derives extra strength from earluer auspicious prints from advanced UK Manufacturing and Services PMIs.

GBP/USD News
USD/JPY rebounds to near 156.50 as BoJ refrains from committing specific rate hike path

USD/JPY rebounds to near 156.50 as BoJ refrains from committing specific rate hike path

USD/JPY recovers sharply to near 156.50 as Japanese Yen underperforms its major peers. The BoJ refrained from providing a specific policy-tightening path. US President Trump has pushed back fears of imposing tariffs on China.

USD/JPY News

Editors’ Picks

EUR/USD flirts with 1.0500 on mixed US PMI readings

EUR/USD flirts with 1.0500 on mixed US PMI readings

 The bullish momentum remains unchanged around EUR/USD on Friday as the pair keeps its trade close to the area of multi-week highs around the 1.0500 barrier in the wake of the release of mixed results from the preliminary US Manufacturing and Services PMIs for the current month. 

EUR/USD News
GBP/USD challenges recent peaks near 1.2450

GBP/USD challenges recent peaks near 1.2450

GBP/USD pushes harder and puts the area of recent two-week highs near 1.2450 to the test on the back of the intense sell-off in the Greenback, while the British pound also derives extra strength from earluer auspicious prints from advanced UK Manufacturing and Services PMIs.

GBP/USD News
Gold keeps the bid bias near its all-time high

Gold keeps the bid bias near its all-time high

Gold prices maintain the bid tone near their record top at the end of the week, helped by the intense weakness around the US Dollar, alleviating concerns surrounding Trump's tariff narrarive, and a somewhat more flexible stance towards China.

Gold News
Dogelon Mars pumps more than 85%, whales dump 128 billion coins and realize a profit

Dogelon Mars pumps more than 85%, whales dump 128 billion coins and realize a profit

Dogelon Mars (ELON) price continues its rally on Friday after rallying more than 18% this week. On-chain data shows that ELON whale wallets realized profits during the recent surge. The technical outlook suggests a rally continuation of the dog-theme meme coin, targeting double-digit gains ahead.

Read more
ECB and US Fed not yet at finish line

ECB and US Fed not yet at finish line

Capital market participants are expecting a series of interest rate cuts this year in both the Eurozone and the US, with two interest rate cuts of 25 basis points each by the US Federal Reserve and four by the European Central Bank (ECB).

Read more

RECOMMENDED LESSONS

7 Ways to Avoid Forex Scams

The forex industry is recently seeing more and more scams. Here are 7 ways to avoid losing your money in such scams: Forex scams are becoming frequent. Michael Greenberg reports on luxurious expenses, including a submarine bought from the money taken from forex traders. Here’s another report of a forex fraud. So, how can we avoid falling in such forex scams?

What Are the 10 Fatal Mistakes Traders Make

Trading is exciting. Trading is hard. Trading is extremely hard. Some say that it takes more than 10,000 hours to master. Others believe that trading is the way to quick riches. They might be both wrong. What is important to know that no matter how experienced you are, mistakes will be part of the trading process.

Trusted Broker Reviews for Smarter Trading

Trusted Broker Reviews for Smarter Trading

VERIFIED Discover in-depth reviews of reliable brokers. Compare features like spreads, leverage, and platforms. Find the perfect fit for your trading style, from CFDs to Forex pairs like EUR/USD and Gold.

Read More

Strategy

Money Management

Psychology