While I purely trade price action setups, trading with Heiken Ashi candles looks beyond interesting. Because of the way this indicator is constructed, traders have an insight into past prices projected to current levels.
How come? And what is Heiken Ashi?
Before anything, it is a candlesticks strategy. Nowadays, all trading platforms offer candlestick charts.
Candlesticks have been introduced to the Western world by Steve Nison. His book, “Japanese Candlestick Charting Techniques” presented a new approach to technical analysis. The Japanese approach.
History tells us candlestick charts appeared in the 18th century, in Japan. A rice trader used them to forecast prices.
By the time Nison presented them to the West, they were quickly embraced. It is no wonder, as the Japanese candlestick techniques are powerful patterns.
Mostly, Japanese candlestick patterns show reversal conditions. That is, after a bullish trend, the market forms a candle, or a group of candles, that show bears trying to take control.
Or bulls, if the trend is bearish. Rarely you’ll find a Japanese candlestick pattern to help traders ride a trend. Unless, there is a retracement towards a previous major level and a price action confirmation.
… but, let’s come back to where Heiken Ashi steps in. It is not a Japanese reversal pattern. But one of the most powerful setups to ride trends.
Defining the Heiken Ashi
Like many others, Heiken Ashi is a charting technique. Or, an indicator.
All trading platforms offer it. The MetaTrader 4, the most popular platform for retail traders, offer it under the Custom indicators.
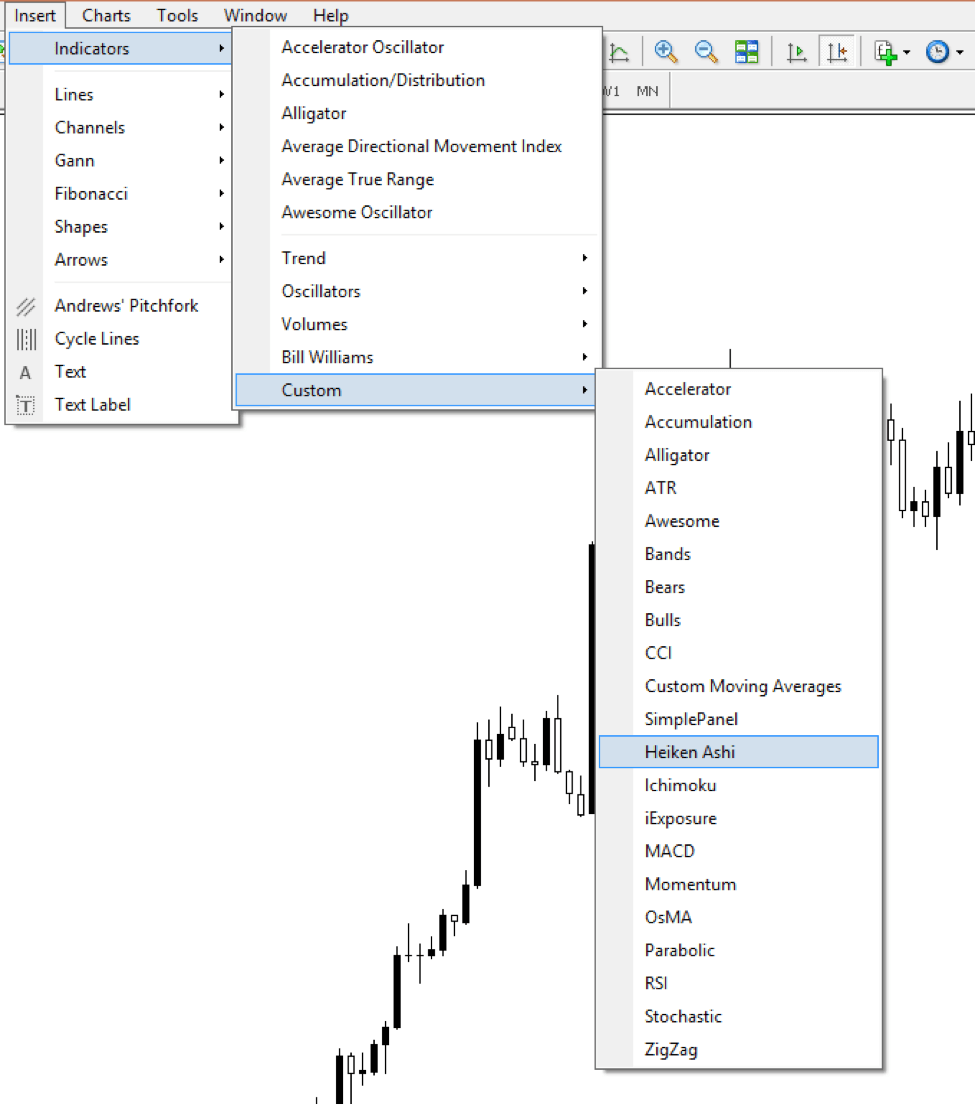
As the MetaTrader suggests, Heiken Ashi is an indicator. More exactly, it is an indicator applied directly on candles.
It changes the current, regular candles, with new ones. The Heiken Ashi price bars are averaged using a specific formula.
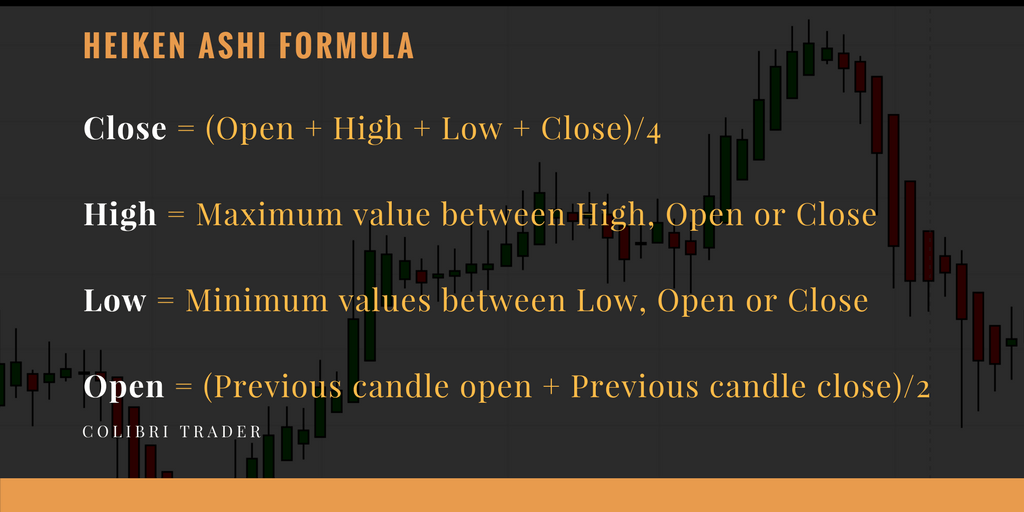
As such, the high, low, closing and opening prices won’t be the same. Here’s the formula Heiken Ashi indicator uses to calculate the four prices mentioned earlier:
Close = (Open + High + Low + Close)/4
High = Maximum value between High, Open or Close
Low = Minimum values between Low, Open or Close
Open = (Previous candle open + Previous candle close)/2
Curious to see what it does to a regular candlestick chart? Let’s find out.
Below is the recent EURUSD four-hour candlestick chart.
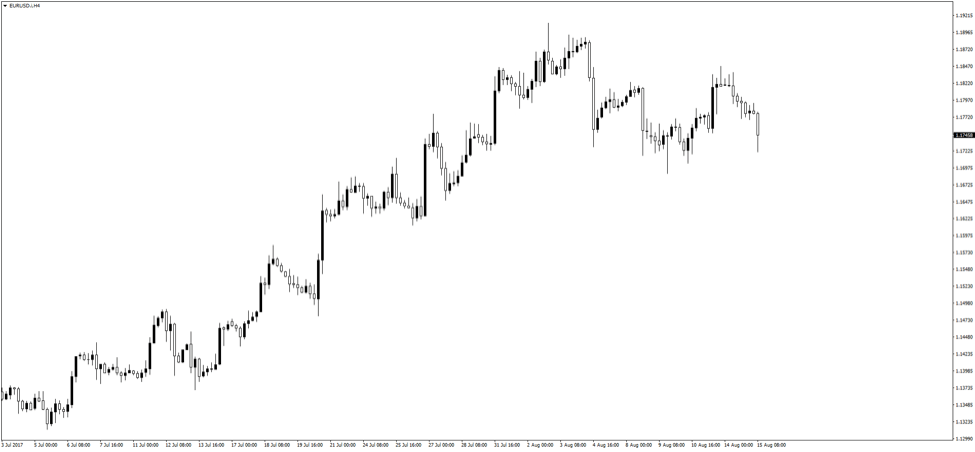
And here’s how it looks with the Heiken Ashi indicator.

The red and blue colors were used to show the shadow and body of bears, respectively bull candles. Now that we know what Heiken Ashi candles represent, how to trade with them?
How to Use a Heiken Ashi Chart
The idea of a Heiken Ashi chart is that it filters the noise. Because the Heiken Ashi candlesticks are the result of averaging prices, the candles will have smaller shadows than a regular candlestick chart.
Other differences exist between a regular candlestick chart and a Heiken Ashi one. For instance, there are no visible gaps on Heiken Ashi charts. That’s the result of averaging prices.
But, like on a classic candlestick chart, the shadows play an important role. We all know the rule of thumb here:
NB: the smaller the shadow, the stronger the trend.
The same in the case of a Heiken Ashi chart. A strong candle with a very small or no shadow shows strong trending conditions.
However, because of averaging, the trend is even stronger. Hence:
Important: Heiken Ashi works best in identifying strong trends.
Take the EURUSD chart above. The pair moved in a strong bullish trend since the French Presidential elections earlier this year.
Check the blue candles. Or, their lower shadows. They have none!
Entry and Exit with Heiken Ashi
Because the way a Heiken Ashi is built, trading trends has never been easier. Because of the averages, the pullbacks in a trend are easy to spot using simple trend lines.
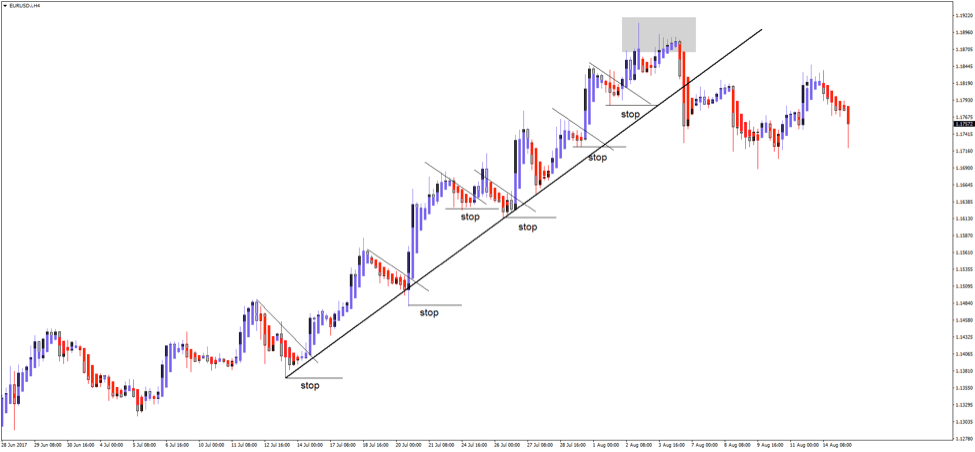
As such, simply draw a trend line highlighting the pullback in a trend. By the moment the price breaks it, by presumption traders go long.
The lower shadow gives indication of where to place a stop. Just pick the minimum value in the pullback.
As for the take profit, this can have either a predetermined value or a target derived from a risk-reward ratio. Usually, this could be a major support/resistance level.
A realistic risk-reward ratio for the Forex market is anywhere between 1:2 and 1:3. That means for every pip risked, the expectation is to make at least two or two and a half in profit. As you have seen from professional trading strategy, when scaling-in, you can reach much higher ratios.
All six trades shown above ended in profit with a 1:2 risk-reward ratio. Not bad for riding a trend, isn’t it?
Trend Reversals with Heiken Ashi
As mentioned earlier, the Heiken Ashi indicator is great for riding trends. Not for picking up reversals.
For this, classical Japanese candlestick patterns will do the trick. However, Heiken Ashi does show some “unusual” activity around a top or a bottom, as well.
In a bullish trend, suddenly, the candles will have larger upper shadows. This shows hesitation. The trend loses its strength.
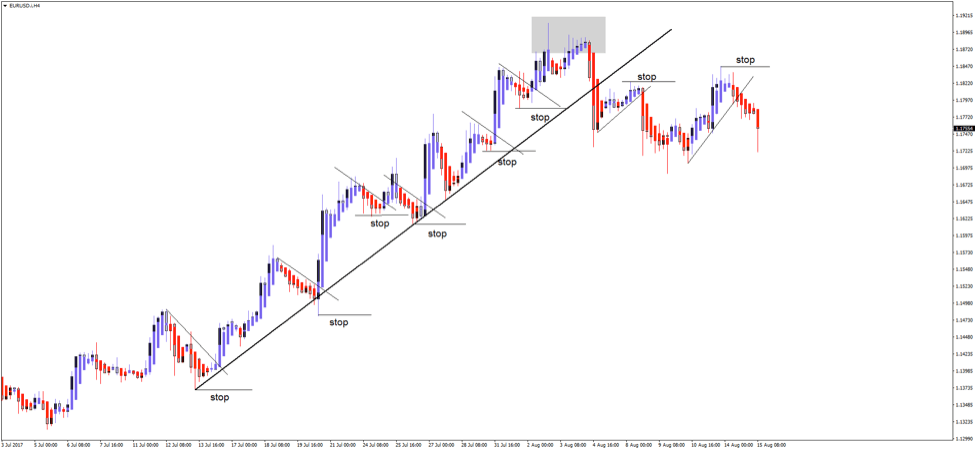
The gray area in the earlier EURUSD chart shows exactly that. It is no wonder that the main trendline gets broken shortly after.
Conclusion
Traders love using the Heiken Ashi because of the powerful setups it offers. When combined with strong discipline and money management, the resulting trades might be quite amazing.
The biggest advantage of using this type of charts is the smoothing appearance. Noise indeed seems to be filtered.
As a result, traders are left with the true move the market makes. There’s little room for error.
Just use the same principle for the EURUSD move that followed the main trend line’s break. The resulting two short trades end up in profit too.
As always, managing risk is the most important part. If trades are the result of a disciplined approach, the trading account will grow.
Any trading setup will simply not work if it isn’t part of a sound money management system. Traders must know the way out of a trade, before getting in.
That’s exactly what Heiken Ashi offers. A disciplined approach to trading.
One that incorporates a nice risk-reward setup. And, one that has a high winning percentage rate. What more can a retail trader ask for?
Final Words: I do not like to jump from one system to another, so I hope you understand this article’s point is to just show you another trading angle. Stick to what works for you! Filter the rest of the noise like a Heiken Ashi Candle!
This material is written for educational purposes only. By no means do any of its contents recommend, advocate or urge the buying, selling or holding of any financial instrument whatsoever. Trading and Investing involves high levels of risk. The author expresses personal opinions and will not assume any responsibility whatsoever for the actions of the reader. The author may or may not have positions in Financial Instruments discussed in this newsletter. Future results can be dramatically different from the opinions expressed herein. Past performance does not guarantee future results.
Editors’ Picks

EUR/USD flirts with daily highs, retargets 1.1900
EUR/USD regains upside traction, returning to the 1.1880 zone and refocusing its attention to the key 1.1900 barrier. The pair’s slight gains comes against the backdrop of a humble decline in the US Dollar as investors continue to assess the latest US CPI readings and the potential Fed’s rate path.

GBP/USD remains well bid around 1.3650
GBP/USD maintains its upside momentum in place, hovering around daily highs near 1.3650 and setting aside part of the recent three-day drop. Cable’s improved sentiment comes on the back of the Greenback’s irresolute price action, while recent hawkish comments from the BoE’s Pill also collaborate with the uptick.

USD/JPY edges up above 153.50 with all eyes on US CPI figures
USD/JPY appreciates above 153.00 but remains on track for a 2.4% weekly loss. Trading volumes remain subdued on Friday, ahead of the IS CPI release. The Yen remains supported by hopes of a stable government and calls for further BoJ tightening.
Editors’ Picks

EUR/USD: Yes, the US economy is resilient – No, that won’t save the US Dollar Premium
Some impressive US data should have resulted in a much stronger USD. Well, it didn’t happen. The EUR/USD pair closed a third consecutive week little changed, a handful of pips above the 1.1800 mark.

Gold: Metals remain vulnerable to broad market mood Premium
Gold (XAU/USD) started the week on a bullish note and climbed above $5,000 before declining sharply and erasing its weekly gains on Thursday, only to recover heading into the weekend.

GBP/USD: Pound Sterling remains below 1.3700 ahead of UK inflation test Premium
The Pound Sterling (GBP) failed to resist at higher levels against the US Dollar (USD), but buyers held their ground amid a US data-busy blockbuster week.

Bitcoin: BTC bears aren’t done yet
Bitcoin (BTC) price slips below $67,000 at the time of writing on Friday, remaining under pressure and extending losses of nearly 5% so far this week.

US Dollar: Big in Japan Premium
The US Dollar (USD) resumed its yearly downtrend this week, slipping back to two-week troughs just to bounce back a tad in the second half of the week.
RECOMMENDED LESSONS
Making money in forex is easy if you know how the bankers trade!
I’m often mystified in my educational forex articles why so many traders struggle to make consistent money out of forex trading. The answer has more to do with what they don’t know than what they do know. After working in investment banks for 20 years many of which were as a Chief trader its second knowledge how to extract cash out of the market.
5 Forex News Events You Need To Know
In the fast moving world of currency markets where huge moves can seemingly come from nowhere, it is extremely important for new traders to learn about the various economic indicators and forex news events and releases that shape the markets. Indeed, quickly getting a handle on which data to look out for, what it means, and how to trade it can see new traders quickly become far more profitable and sets up the road to long term success.
Top 10 Chart Patterns Every Trader Should Know
Chart patterns are one of the most effective trading tools for a trader. They are pure price-action, and form on the basis of underlying buying and selling pressure. Chart patterns have a proven track-record, and traders use them to identify continuation or reversal signals, to open positions and identify price targets.
7 Ways to Avoid Forex Scams
The forex industry is recently seeing more and more scams. Here are 7 ways to avoid losing your money in such scams: Forex scams are becoming frequent. Michael Greenberg reports on luxurious expenses, including a submarine bought from the money taken from forex traders. Here’s another report of a forex fraud. So, how can we avoid falling in such forex scams?
What Are the 10 Fatal Mistakes Traders Make
Trading is exciting. Trading is hard. Trading is extremely hard. Some say that it takes more than 10,000 hours to master. Others believe that trading is the way to quick riches. They might be both wrong. What is important to know that no matter how experienced you are, mistakes will be part of the trading process.
The challenge: Timing the market and trader psychology
Successful trading often comes down to timing – entering and exiting trades at the right moments. Yet timing the market is notoriously difficult, largely because human psychology can derail even the best plans. Two powerful emotions in particular – fear and greed – tend to drive trading decisions off course.