How to enter and exit trades with fibonacci tool

As you might know, the Fibonacci tool is a very valuable indicator for spotting support and resistance but the indicator can also be used for trading decisions.
This article explains how to use the Fibs for actual trading entries… but the Fib tool also helps provide a better spot for placing the stop loss. Let’s start.
Fibonacci for Entries
Traders can use the Fibonacci retracement levels for two different ways of entering. Here are the two main methods:
-
Pending orders for immediate and direct entries can be placed at the Fib levels
-
Traders can wait for confirmation triggers at the desired Fib levels before actually entering
Placing pending orders at the Fibonacci levels requires more confidence in one’s analysis and Fib placement skills because price must first retrace before reaching the pending order. This means traders are trading against the short-term momentum and hoping that price will bounce before hitting their stop loss.
Waiting for confirmation triggers means that we are waiting for the price to reach my desired Fibonacci level but I am not entering when the price reaches the Fib. Instead, I am waiting for the price to react (in my anticipated direction) to the Fibonacci level before taking an entry. The best reaction is a candlestick confirmation at the expected Fib level. An example of a candlestick pattern could be engulfing twins for instance.
Which one is better? Some traders are opposed to waiting for a confirmation as the entry price tends to be worse in comparison with the confirmation, which is true but there are two distinct advantages of waiting.
-
Fibonacci levels on a higher time frame are often the most respected but also the most difficult to trade from a practical point of view. Or in other words, the market highly respects the levels but the space between the bottom and the 50 Fib could be enormous on the 4 hour chart and practically impossible for many traders to trade (due to risk management rules and small account sizes). Waiting for a price reaction enables a trader to use a tighter stop loss for this setup as the recent candle high or low plus a buffer could be employed.
-
The 2nd advantage is connected to the fact that the probability of a setup succeeding varies per trade when placing the Fib tool on the charts. If I have too much doubt whether the market will respect the Fib level, then waiting for a reaction solves that issue. This is especially important for traders who have less experience when placing Fibs on the charts. This is an important method to improve one’s Fib trading when you are just starting out with Fibs.
More is explained in our special Elliott Wave Patterns & Fibonacci Relationships Core Reference Guide.
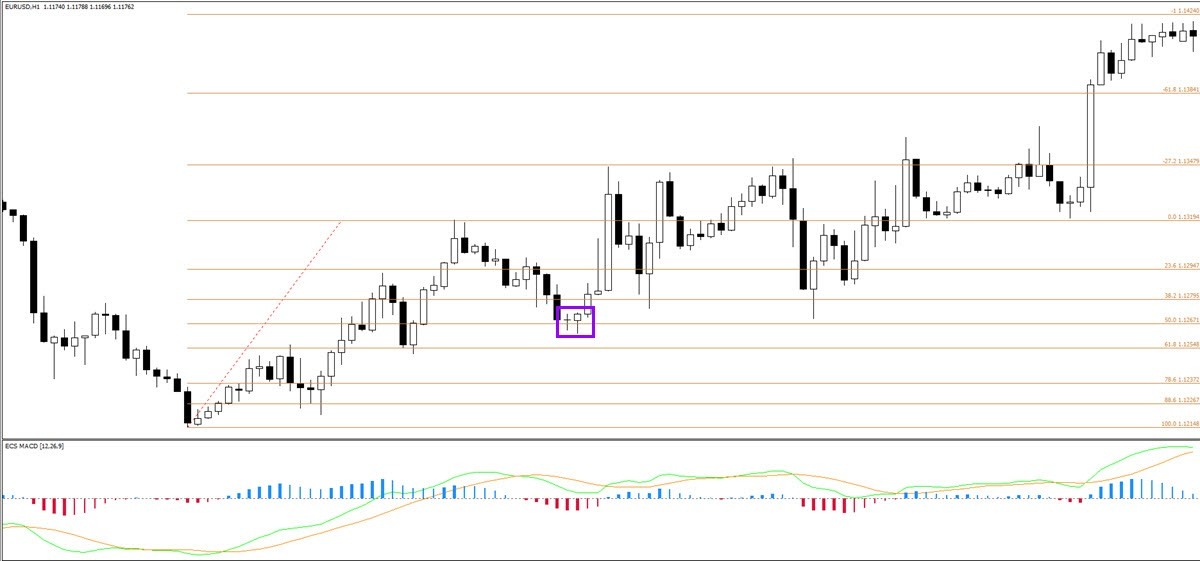
Image: Fibonacci 21 (swing folder)
All in all, the difference between a trigger and an entry could seem quite small. However, it is worth sacrificing a few pips and getting a slightly worse entry if the probability of the Fib working out is low or average OR if you are relatively new to Fib trading.
Personally we are using Fibs as a trigger anytime when reviewing daily chart or higher as in those cases we are not willing to commit to a Fib trade via a pending order. Then the stops are quite large and trades take too long to develop, which means that the capital is stuck and blocking potential new setups. When analyzing a 4 hour chart or lower, traders can use Fibs as either a trigger or as an entry depending on the probability of each setup.
Stop Loss with Fibs
Many traders seek out a tight stop loss in order to increase their lot size (with the same risk). That idea could, however, be hazardous for your account. Why?
-
The markets move up and down, show lots of volatility, and retest price zones often.
-
The ‘noise of the market’ implies that all stop losses are to some degree vulnerable to being triggered before price makes a sustainable one directional movement.
-
An (over) tight stop loss will have more issues due to this market volatility. The chart above shows how choppy price action can be hazardous for tight stop losses… but there is a solution: the invalidation spot.
The best stop loss placement is “simple”: place it at a spot where your analysis is invalidated if price pushes beyond that point. There are 2 benefits:
-
You exit the trade at a loss ONLY if the analysis proves incorrect.
-
You are not psychologically annoyed with the loss because you placed it at a sport where your analysis was in fact not on the mark.
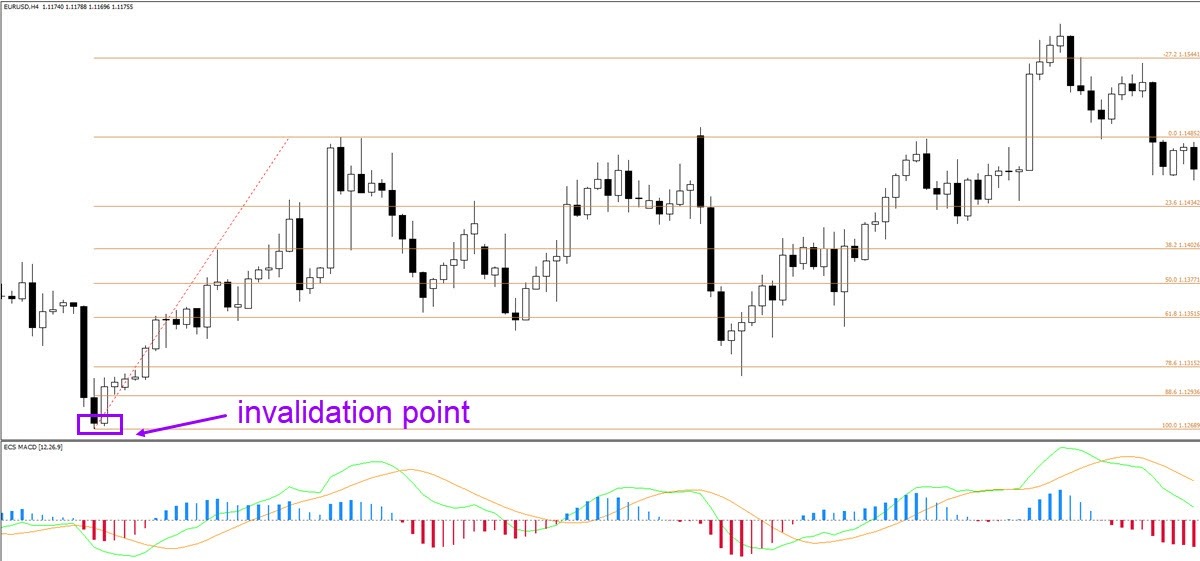
Image: Fibonacci 23 (swing folder)
Many traders do not place a stop loss at an invalidation point. They see their stop loss get hit but their analysis can easily turn out to be right. Do you recognize the annoyance that your analysis was correct but your trade ends up for a loss? Only to see the market turn around into your expected direction after you get taken out?
This process leads to revenge trading, over risking, and other nasty and costly bad habits. Using the invalidation level creates a peace of mind: a stop loss only triggers if the market is turning into a different direction.
Finding the invalidation level with the Fibonacci tool is straightforward: the stop loss should go below the 100 mark if trading on a lower time frame. When a trader places their Fibonacci tool from left to right, they will have the 100 mark either at the bottom (when Fibbing an uptrend) or at the top (when Fibbing a downtrend).
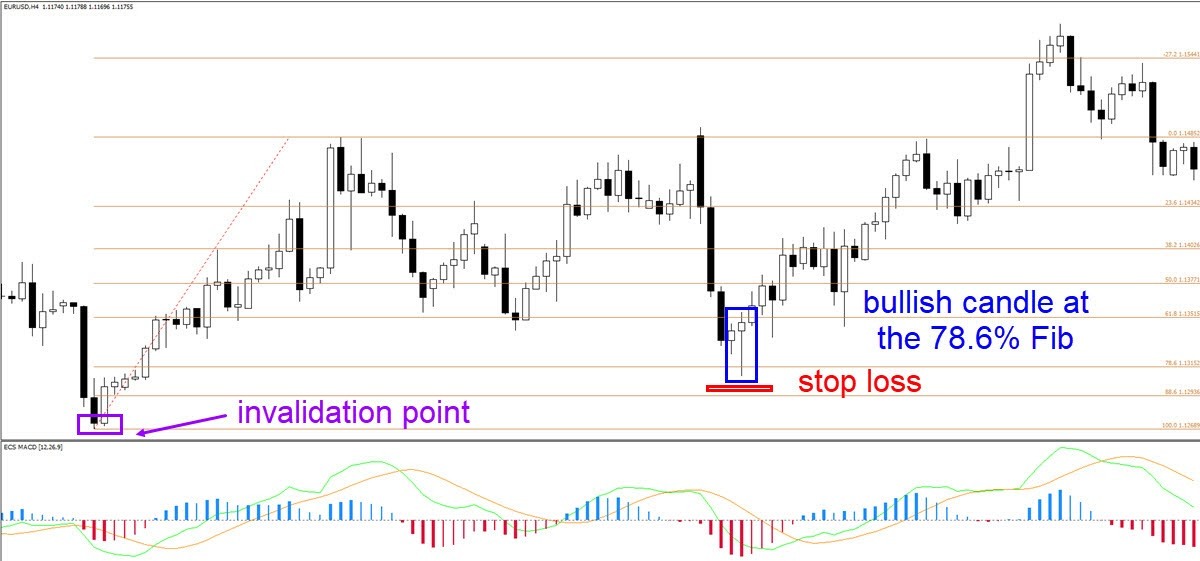
Image: Fibonacci 22 (swing folder)
The bottom or top of the Fibonacci level is where the trade and analysis is invalidated because Fib traders will only place the Fib tool on an appropriate/sturdy swing. Now you understand why placing the Fib on the correct swing or leg of price movement is so crucial… the Fib tool not only indicates entries and targets but also the correct stop loss level. Make sure to use the correct swing and hence the correct Fib.
Personally we tend to place the stop loss a few pips away from the bottom or top. On a 1-hour chart this could be 5-10 pips whereas a 4-hour chart might be 10-15 pips. We like to provide more leeway for my trades, just in case price retests the bottom or top.
There are some valid reasons to use a tighter stop loss. If you see a (strong) candlestick reaction at the Fibonacci level, then using a stop loss below the candle low or above the candle high could be a valid approach. Stop losses just beyond a strong Fibonacci level can work out fine and offer better reward to risk ratios. The key element is to have sufficient confluence on the charts at that particular level.
The analysis has been done with the ecs.SWAT method and ebook.
Author

Chris Svorcik
FS method
Chris Svorcik is a trader, analyst, and educator with over 15 years of experience in financial markets, specializing in moving averages, market structure, and price patterns.


