How to benefit from trade reversals using pin bar signals

If you can spot a trend reversal you will become a very successful margin trader. That’s what’s it all about.
Let’s begin with what a reversal is. This is the point when the trend changes. You can see a price of Bitcoin, gold, or a currency pair going up with some smaller corrections. Until each local high and low is higher than the previous high and low, we are dealing with an uptrend.
The same is true the other way around. The price of an asset goes down you can see the trend if the local ups and downs are lower than the previous ones. The local rallies (increases in the price) are called retracements. You can also use them to enter the market at a better price.
You can imagine why making the difference between a retracement and a trend reversal is a key part of a successful trade. If you time it right, you will be able to make great gains.
On the other hand, if you notice a reversal and have an opposite position open, you want to close it as soon as possible. So identifying the trend reversal also helps you avoid a potential loss.
A pin bar is a common reversal pattern. It’s easy to spot and many margin traders find it very useful. You can spot the pin bar pattern using the Japanese candlestick chart view.
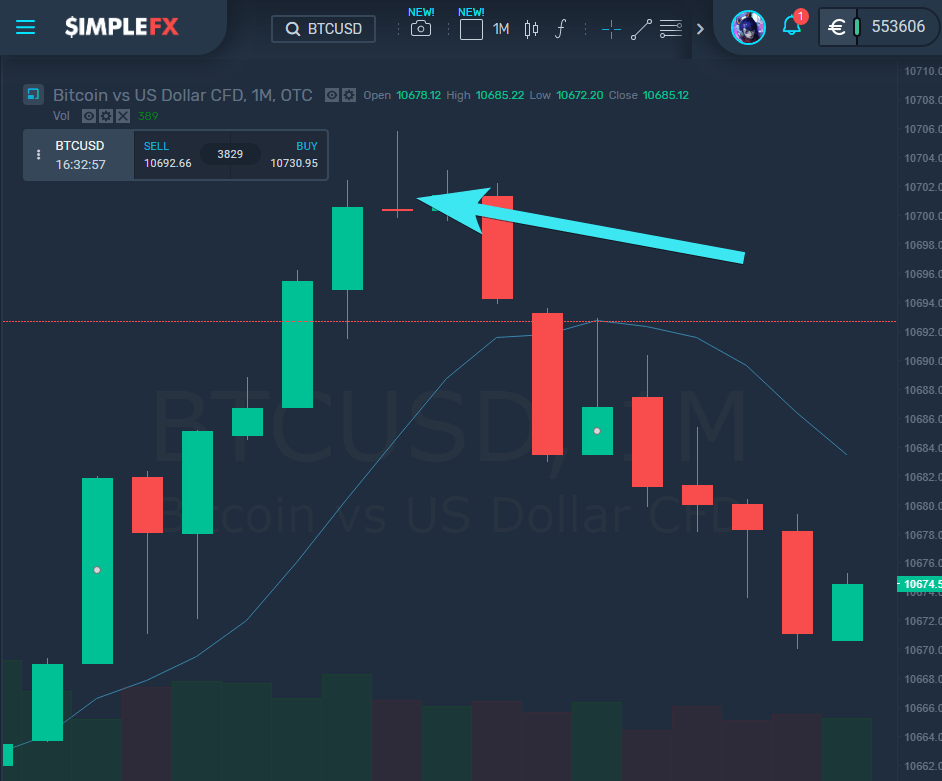
Above you can see an example of a red bearish pin bar that may signal a reversal from uptrend to downtrend.
The pin bar as a long wick and a short body. In the case of this red pin bar, the shape indicates that the price went up for a while, but then all the way down to the level indicated by the bottom of the candle’s body.
Here are some characteristics of a pin bar pattern to more likely signal a trend change:
-
Its wick has to be longer than the body
-
Its wick has to be longer than the wicks of previous candlesticks
-
Its body has to be on one side of the wicks
-
Its body has to be enclosed in the previous candlestick body.
You can also confirm the pattern with some other indicators, such as support and resistance or trend lines. You can also combine it with a moving average indicator.
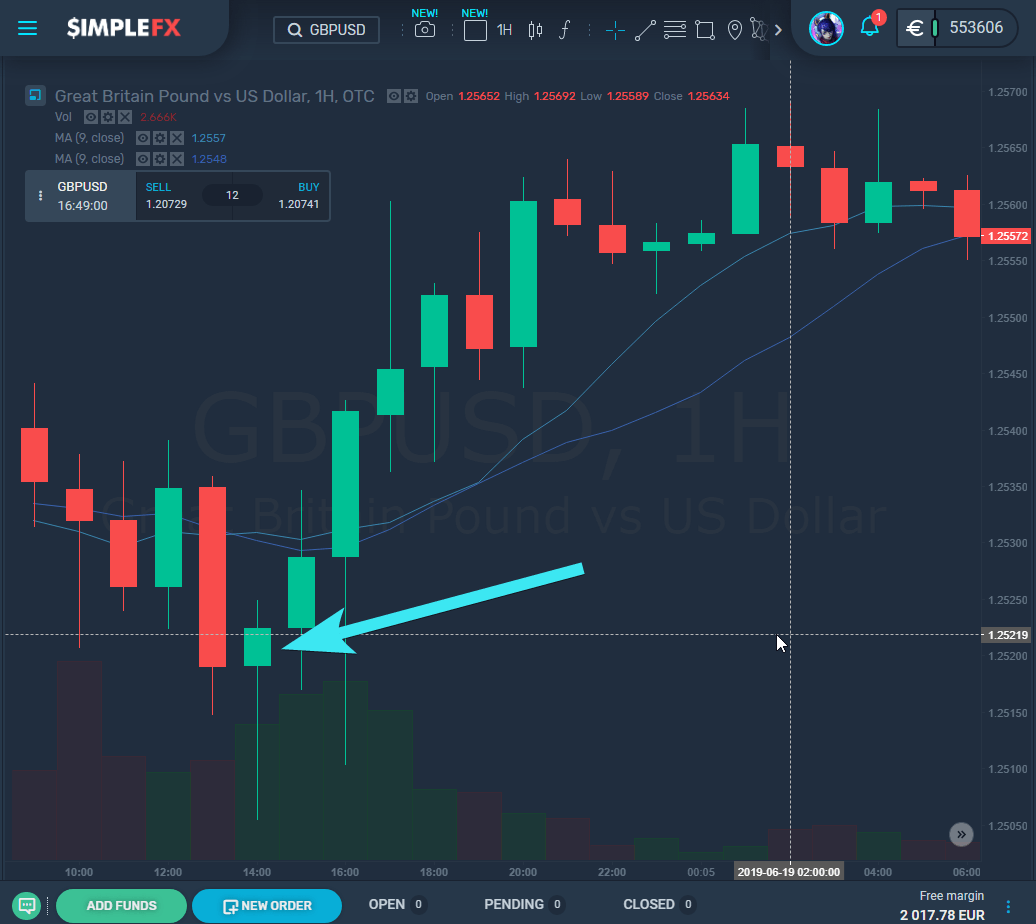
Now, let’s discuss when to make an entry then seeing a pin bar pattern. In the one-hour GBPUSD chart above you can see an example of a bullish green pin bar that signaled a reversal from a downtrend to an uptrend.
You can safely make the order at the close of the period (which is the upper edge of the body since it’s a green candlestick). This will hedge your position against the scenario when the pattern doesn’t work.
You can also consider trading at the tip of the nose (the upper wick) of such a bullish pin bar. You may also try trading at the break of the nose.
All these strategies have their trade-offs. The lower you try to buy the upward reversal, the higher the profit you may get, but then take more risks if the signal proves to be false.
You should also adjust your stop-loss points accordingly. If you put them too tight, you may be stopped out from your position even if you identify the trend swift correctly.
Remember, you should avoid entering too early or too late as you can lose the profit.
Author

SimpleFX Team
SimpleFX


