![]() Russ Allen
Russ Allen
Online Trading Academy
This is a question faced by almost everyone. Buffets and Gateses of the world aside, most of us must consider what it will take to live comfortably after we stop doing whatever we do for a living. No one wants their money to run out during their lifetime. Given time and prior planning, we can do our best to make sure this doesn’t happen.
There are several variables to be taken into account doing retirement planning. An easy way to explain this is by reference to a retirement calculator. These are offered by many vendors of financial products.
The purpose of this retirement planner is to help you to estimate how much money you are likely to have accumulated when you retire; and to determine the rate of return that is needed on your current and future savings to ensure that your money lasts as long as you do.
Here is a screenshot of the inputs that the retirement planner asks for. A description of each item is given below.
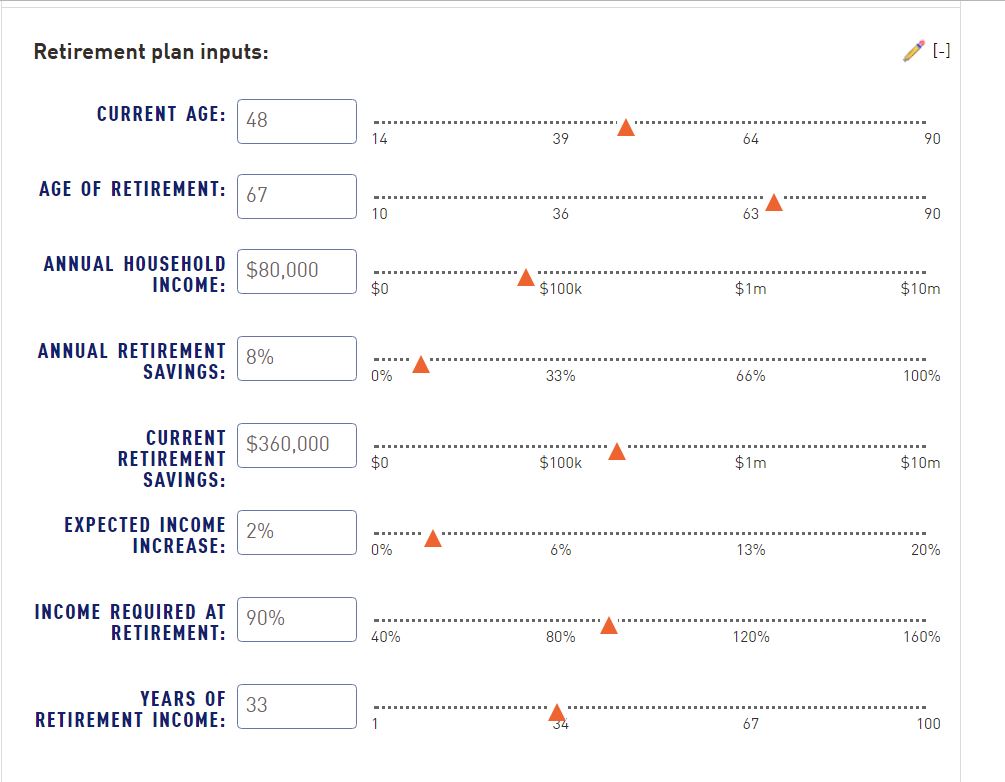
Here is what these fields mean:
Note: For some of them, the meaning is different for those who are already retired vs. those who are not.
Section 1 – Income and Retirement Savings
Current Age:
Self-explanatory
Age of Retirement:
If not yet retired: The age at which you plan to retire (this may be changed based on your findings).
If retired: Enter your current age here also.
Annual Household Income:
This amount will be used to estimate how much per year you will need to withdraw from your retirement savings. The assumption is that you spend this amount of money per year, minus the percentage that you enter below for “Annual Retirement Savings”.
If not yet retired: Enter your after-tax household income from all sources.
If retired: Your instructions are different. Enter here the amount of money that you spend per year to live, minus whatever portion of that spending comes from assured sources like pensions or social security; or from assets outside your retirement savings.
For example, say that your living expenses total $8,000 per month, or $96,000 per year. You receive Social Security benefits of $18,000 per year and a pension of $ 20,000 per year. You also collect $25,000 per year in net cash flow from a real estate property that you plan to keep indefinitely. The amount you would enter for “household income” would be $96,000 – $18,000 – $20,000 – $25,000 = $33,000. This would represent the amount of annual withdrawals needed from Retirement Savings.
Annual Retirement Savings:
If not yet retired: The amount, going forward, that you plan to contribute to your retirement savings, as a percentage of the “Household Income” amount.
For example, you receive salary and bonus income of $100,000 gross, pay taxes of $28,000, and earn $72,000 after tax. You would have entered $72,000 as “Household Income”. You save 6% of your $100,000 gross salary, or $6,000 per year. This savings might be in the form of a contribution to your 401(k), or private savings, or a combination. The amount to enter here would be the $6,000 contribution divided by $72,000 “household income,” which is 6,000/72,000 = 8.33%.
If retired: Enter zero as this does not apply if you are retired.
Current Retirement Savings:
If not yet retired: The total amount in your savings accounts, 401(k) plan(s), and any other investments whose income can be used to support yourself in the future. Do not include the value of your home(s), personal property, or any other assets that will not be tapped for retirement income.
Also, do not include the value of real estate investments, estates or trusts, or anything else that you cannot, or have no plans to liquidate and invest. Instead, if these assets generate cash flow deduct that cash flow from the “Household Income” number as described in that section above.
If retired: Same definition as for “not yet retired”.
Expected Income Increase:
If not yet retired: If you expect your income to increase in the years between now and retirement, enter an estimated annual percentage increase. Note that the bigger you make this number, the higher the income that must be replaced when you retire.
If retired: Enter zero as this does not apply if you are retired.
Income Required at Retirement:
If not yet retired: If you expect your spending needs to go down after retirement, enter a percentage less than 100%. For example, if you are currently saving (contributing toward your retirement) 8% of your income, then your Income Required at Retirement is at most 92%, since you will not continue to contribute after retirement. If you now have a mortgage that will be paid off when you retire and mortgage payments currently consume 15% of the “household income” amount, then you can reduce this by another 15%.
If retired: Enter 100%.
Years of Retirement Income:
How long you expect to live after retirement (or from now, if retired).
Section 2 – Investment returns
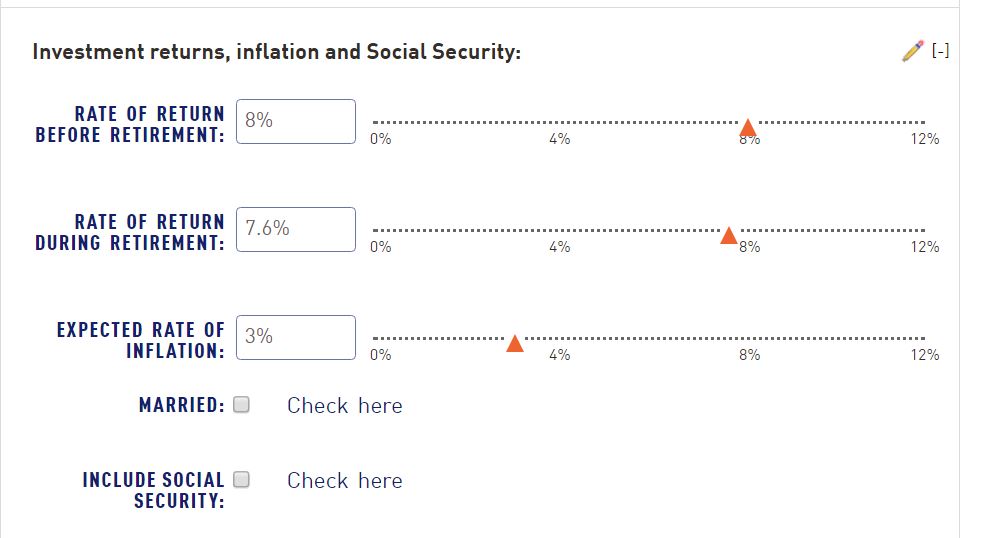
Rate of Return Before Retirement:
If not yet retired: The annual rate of return that you plan to target on the investments that make up your Retirement Savings, in the period before you retire. As a starting point you could enter 7%, the historic average return on long-term blended portfolios of stocks and bonds. This can be adjusted.
If retired: Enter zero as this does not apply if you are retired.
Rate of Return During Retirement:
If not yet retired: The annual rate of return that you plan to target on the investments that make up your Retirement Savings, in the period after you retire. Most people target a lower rate of return after retirement since more money will be shifted to less risky investments like bonds and cash, and away from assets that have higher returns but more risk, like stocks.
If retired: Same definition as above.
Expected Rate of Inflation:
If not yet retired: We have to consider that the amount we need to spend will increase over time due to inflation. The historic average is around 3%. You can use a different number if your opinion on future inflation differs.
If retired: Same definition as above.
Include Social Security:
If not yet retired: Check the box if you have paid into the Social Security system and believe that you will collect benefits. The Planner will estimate your benefits. Otherwise, do not check the box.
If retired: Do not check the box, whether you receive Social Security benefits or not. You already deducted your actual social security benefits from the Household Income number above. This is more accurate than an estimate that the planner would make.
Married:
This box only matters if you checked the “Include Social Security” box. If checked, it will increase your estimated Social Security benefits by 50%.
RESULTS
You’ve now completed all fields in the retirement planning calculator and the result of your inputs will be in the form shown below:
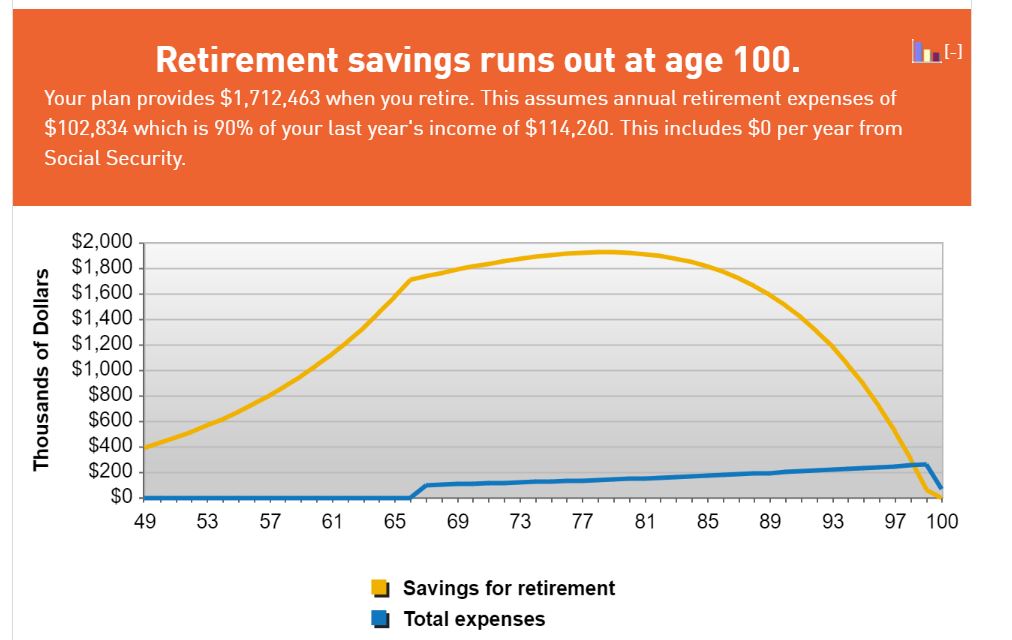
The gold line in the above graph tracks the estimated value in your retirement savings given the inputs you entered. What you want to see is the gold line staying above zero as long as you stay above ground. If the result is that you have money left in the kitty at the end of the chart, you’re in good shape. You should just re-check your retirement plan once a year to see if any changes require a mid-course correction.
If the graph is projected to hit zero balance at an earlier age, then something has to give. These are the things you can change to adjust your retirement plan:
-
You can plan to work longer, if you’re not already retired. Plugging in a later Age of Retirement will change things.
-
You can increase your contribution to your retirement, if still working. A higher percentage contribution will improve things.
-
You can reduce the amount you plan to spend when retired, by entering a smaller percentage under Income Required at Retirement (only if you are not already retired).
Most people would prefer not to have to do any of the above three things when planning for retirement. The first thing you will probably want to try instead is to target a higher rate of return in the Rate of Return Before Retirement and/or Rate of Return During Retirement fields. As you change these, you will see the results change. In our retirement planning example from above, here is the result of changing the estimate for Rate of Return During Retirement from 7.6% to 8%:
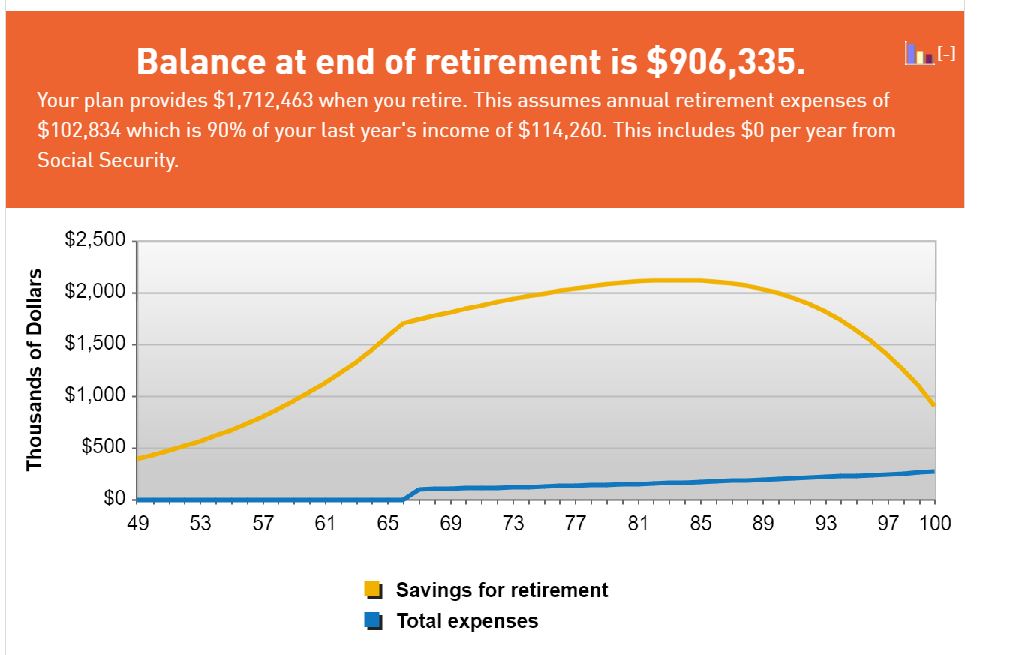
Now instead of “your retirement savings run out at age 100” we see “Balance at end of retirement is $906,335.” That 4/10 of a percent difference, from 7.6% to 8%, made the difference between just making it and having $906,000 as a cushion, or to leave to your children or charity.
There is no such thing as a guaranteed 8% on your money, in a world of 2-3% interest. But with investments carefully chosen and properly managed, you have the best chance of making your retirement work for you. That is the purpose of the Proactive Investor program. However you plan to manage your retirement, the first step is knowing what your target is.
This content is intended to provide educational information only. This information should not be construed as individual or customized legal, tax, financial or investment services. As each individual's situation is unique, a qualified professional should be consulted before making legal, tax, financial and investment decisions. The educational information provided in this article does not comprise any course or a part of any course that may be used as an educational credit for any certification purpose and will not prepare any User to be accredited for any licenses in any industry and will not prepare any User to get a job. Reproduced by permission from OTAcademy.com click here for Terms of Use: https://www.otacademy.com/about/terms
Editors’ Picks

EUR/USD flirts with daily highs, retargets 1.1900
EUR/USD regains upside traction, returning to the 1.1880 zone and refocusing its attention to the key 1.1900 barrier. The pair’s slight gains comes against the backdrop of a humble decline in the US Dollar as investors continue to assess the latest US CPI readings and the potential Fed’s rate path.

GBP/USD remains well bid around 1.3650
GBP/USD maintains its upside momentum in place, hovering around daily highs near 1.3650 and setting aside part of the recent three-day drop. Cable’s improved sentiment comes on the back of the Greenback’s irresolute price action, while recent hawkish comments from the BoE’s Pill also collaborate with the uptick.

USD/JPY edges up above 153.50 with all eyes on US CPI figures
USD/JPY appreciates above 153.00 but remains on track for a 2.4% weekly loss. Trading volumes remain subdued on Friday, ahead of the IS CPI release. The Yen remains supported by hopes of a stable government and calls for further BoJ tightening.
Editors’ Picks

EUR/USD: Yes, the US economy is resilient – No, that won’t save the US Dollar Premium
Some impressive US data should have resulted in a much stronger USD. Well, it didn’t happen. The EUR/USD pair closed a third consecutive week little changed, a handful of pips above the 1.1800 mark.

Gold: Metals remain vulnerable to broad market mood Premium
Gold (XAU/USD) started the week on a bullish note and climbed above $5,000 before declining sharply and erasing its weekly gains on Thursday, only to recover heading into the weekend.

GBP/USD: Pound Sterling remains below 1.3700 ahead of UK inflation test Premium
The Pound Sterling (GBP) failed to resist at higher levels against the US Dollar (USD), but buyers held their ground amid a US data-busy blockbuster week.

Bitcoin: BTC bears aren’t done yet
Bitcoin (BTC) price slips below $67,000 at the time of writing on Friday, remaining under pressure and extending losses of nearly 5% so far this week.

US Dollar: Big in Japan Premium
The US Dollar (USD) resumed its yearly downtrend this week, slipping back to two-week troughs just to bounce back a tad in the second half of the week.
RECOMMENDED LESSONS
Making money in forex is easy if you know how the bankers trade!
I’m often mystified in my educational forex articles why so many traders struggle to make consistent money out of forex trading. The answer has more to do with what they don’t know than what they do know. After working in investment banks for 20 years many of which were as a Chief trader its second knowledge how to extract cash out of the market.
5 Forex News Events You Need To Know
In the fast moving world of currency markets where huge moves can seemingly come from nowhere, it is extremely important for new traders to learn about the various economic indicators and forex news events and releases that shape the markets. Indeed, quickly getting a handle on which data to look out for, what it means, and how to trade it can see new traders quickly become far more profitable and sets up the road to long term success.
Top 10 Chart Patterns Every Trader Should Know
Chart patterns are one of the most effective trading tools for a trader. They are pure price-action, and form on the basis of underlying buying and selling pressure. Chart patterns have a proven track-record, and traders use them to identify continuation or reversal signals, to open positions and identify price targets.
7 Ways to Avoid Forex Scams
The forex industry is recently seeing more and more scams. Here are 7 ways to avoid losing your money in such scams: Forex scams are becoming frequent. Michael Greenberg reports on luxurious expenses, including a submarine bought from the money taken from forex traders. Here’s another report of a forex fraud. So, how can we avoid falling in such forex scams?
What Are the 10 Fatal Mistakes Traders Make
Trading is exciting. Trading is hard. Trading is extremely hard. Some say that it takes more than 10,000 hours to master. Others believe that trading is the way to quick riches. They might be both wrong. What is important to know that no matter how experienced you are, mistakes will be part of the trading process.
The challenge: Timing the market and trader psychology
Successful trading often comes down to timing – entering and exiting trades at the right moments. Yet timing the market is notoriously difficult, largely because human psychology can derail even the best plans. Two powerful emotions in particular – fear and greed – tend to drive trading decisions off course.