Each day the global financial markets are impacted by events that cause traders to react in dramatic fashion.  These responses quite often will have a ripple effect that can stretch across all types of markets and asset classes.  In other words, what happens in one market will in turn move another related market. For newer traders, it’s important to understand this relationship. In this post, I’ll go over some of the strongest inverse market correlations and their uses to help traders gain an edge.

But before we get started, there is one major caveat about this topic: correlations usually hold, however, there are times when what seemed to be a strong correlation between two markets breaks and no longer works. This is often a temporary phenomenon as strong correlations always revert back. An astute trader must be attuned to these changes and be flexible enough to make the adjustments necessary to keep his edge.

The first inverse correlation we’ll go over is the one between stocks and bonds.  For stocks, we’ll use the ES (S&P 500 mini) against the (US) 30-year treasury bond futures contract to do the analysis.  This is a simple risk-on versus risk-off correlation.  What is meant by this is that theoretically, stocks are inherently riskier than bonds and therefore when stocks are moving higher investors generally have a bigger appetite for risk and would sell the lower yielding bond market. This changes however, when things get rough in the stock market.  Investors seek the safe harbor of treasuries, and in order to raise the cash necessary to purchase these fixed yielding instruments, they sell their stock holdings.  The two annotated charts below illustrate these inverse correlations.

Lessons from the Pros - Futures

SP

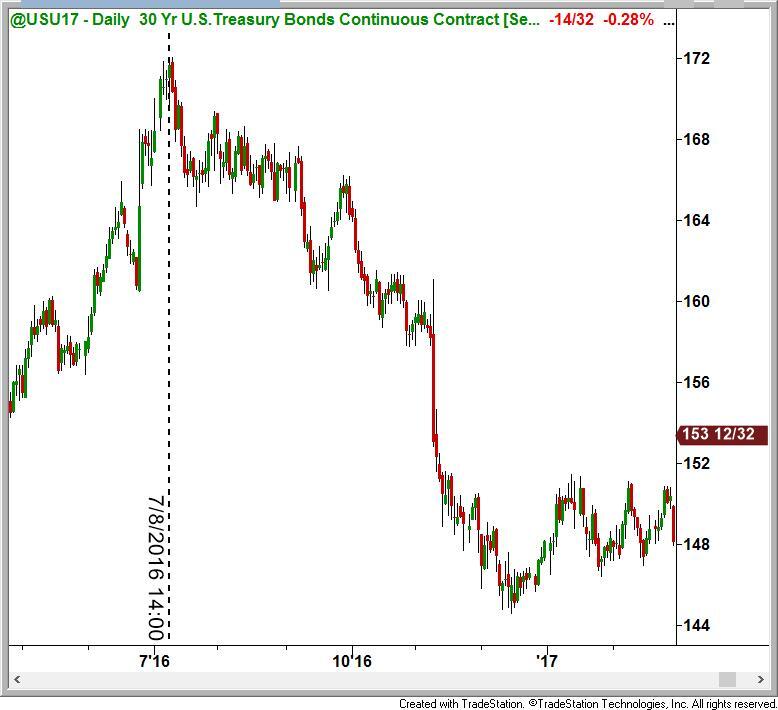
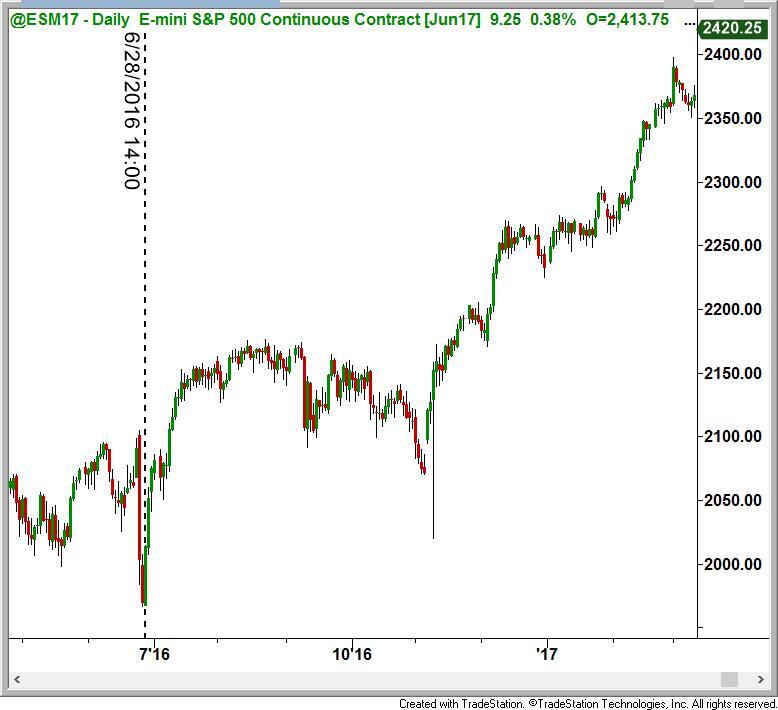
We can see that major inverse moves happened pretty regularly in these two asset classes. The key for traders is to find both markets entering opposing levels simultaneously, thus increasing the probabilities of timing the turning points.  This correlation is important for traders who engage the markets on an intermediate-term time frame as it can be a major odds enhancer. Identifying the quality supply and demand levels is the most important element of this equation.

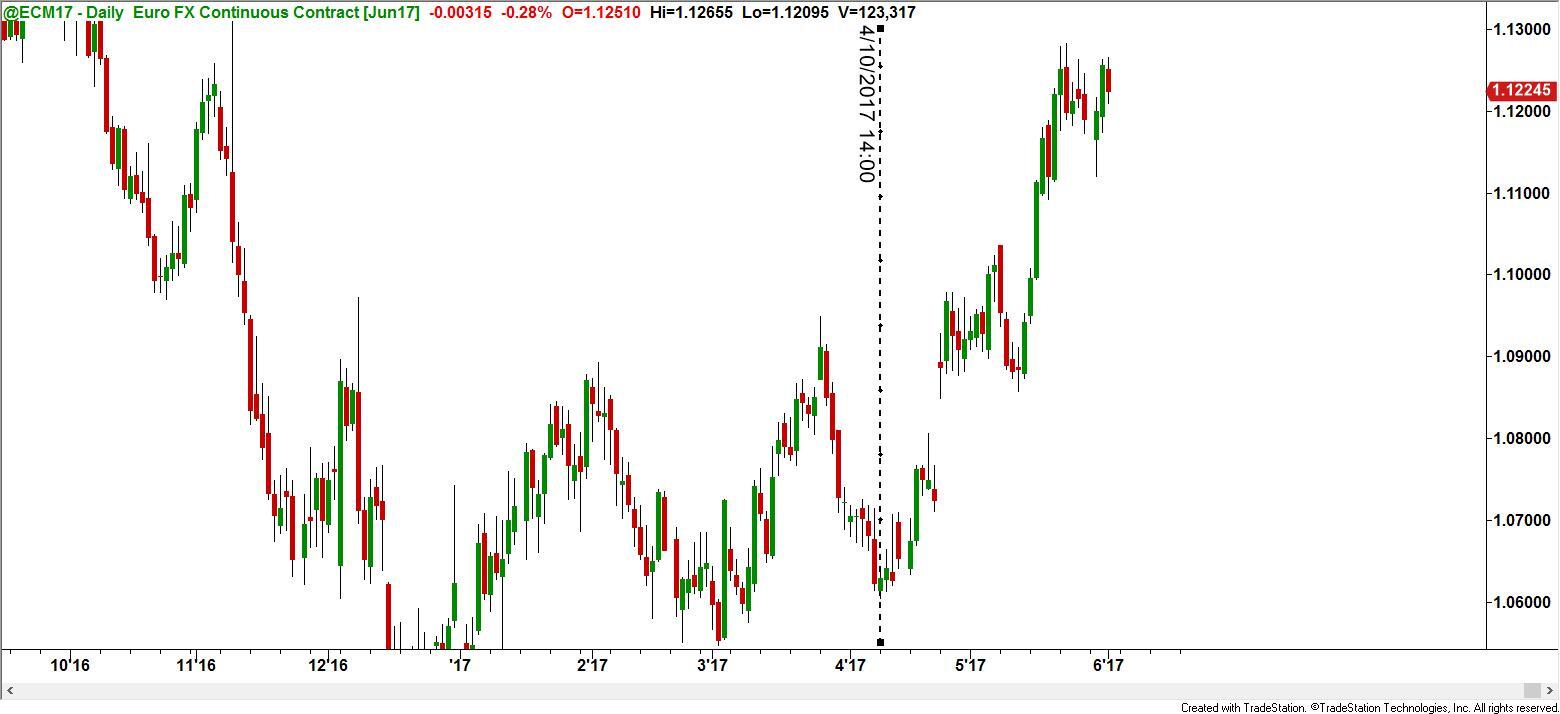
The other inverse correlation we’ll look at is that of the US Dollar index against the Euro Currency.  This is a very strong inverse correlation because of how the Dollar Index is comprised, and the way the currency futures contracts are traded.  First, the Dollar index is a basket of currencies traded against the US Dollar. The biggest component of this index is the Euro currency constituting over 57% of the index. In addition, currency futures are only the major global currencies (major industrialized countries) relative to the US dollar. In other words, they track the exchange rates of two currencies; because of this, the moves in the Euro currency greatly impacts the Dollar index.  Similar to the Stock-Bond inverse correlation, we can see on the charts below that all the major moves happened on the same day.

ECM

DXY

For traders trying to gain an edge, learning how different markets impact one another is a must.  Not knowing how the US Dollar can change the trajectory of commodities such as oil, copper or gold is a big disadvantage, especially when you’re competing with large banks and institutions who wouldn’t think of putting their traders on the front lines if they didn’t understand how the markets impact one another. If you want to have a chance to compete successfully you need to start thinking and acting like them; and one part of that is gaining an understanding of the interrelationships between markets. For the novice trader having a basic understanding of these two correlations is a good starting point.

Until next time, I hope everyone has a great week.

Learn to Trade Now


This content is intended to provide educational information only. This information should not be construed as individual or customized legal, tax, financial or investment services. As each individual's situation is unique, a qualified professional should be consulted before making legal, tax, financial and investment decisions. The educational information provided in this article does not comprise any course or a part of any course that may be used as an educational credit for any certification purpose and will not prepare any User to be accredited for any licenses in any industry and will not prepare any User to get a job. Reproduced by permission from OTAcademy.com click here for Terms of Use: https://www.otacademy.com/about/terms

Editors’ Picks

EUR/USD climbs toward 1.1800 on broad USD weakness

EUR/USD climbs toward 1.1800 on broad USD weakness

EUR/USD gathers bullish momentum and advances toward 1.1800 in the second half of the day on Tuesday. The US Dollar weakens and helps the pair stretch higher after the employment report showed that Nonfarm Payrolls declined by 105,000 in October before rising by 64,000 in November.

GBP/USD climbs to fresh two-month high above 1.3400

GBP/USD climbs to fresh two-month high above 1.3400

GBP/USD gains traction in the American session and trades at its highest level since mid-October above 1.3430. The British Pound benefits from upbeat PMI data, while the US Dollar struggles to find demand following the mixed employment figures and weaker-than-forecast PMI prints, allowing the pair to march north.

Japanese Yen seems poised to appreciate further; awaits BoJ decision on Friday

Japanese Yen seems poised to appreciate further; awaits BoJ decision on Friday

The Japanese Yen maintains its bid tone through the first half of the European session on Tuesday which, along with a bearish US Dollar, keeps the USD/JPY pair depressed below the 155.00 psychological mark. The growing acceptance that the Bank of Japan will raise interest rates this week turns out to be a key factor behind the safe-haven JPY's outperformance.


Editors’ Picks

EUR/USD climbs toward 1.1800 on broad USD weakness

EUR/USD climbs toward 1.1800 on broad USD weakness

EUR/USD gathers bullish momentum and advances toward 1.1800 in the second half of the day on Tuesday. The US Dollar weakens and helps the pair stretch higher after the employment report showed that Nonfarm Payrolls declined by 105,000 in October before rising by 64,000 in November.

GBP/USD climbs to fresh two-month high above 1.3400

GBP/USD climbs to fresh two-month high above 1.3400

GBP/USD gains traction in the American session and trades at its highest level since mid-October above 1.3430. The British Pound benefits from upbeat PMI data, while the US Dollar struggles to find demand following the mixed employment figures and weaker-than-forecast PMI prints, allowing the pair to march north.

Gold extends its consolidative phase around $4,300

Gold extends its consolidative phase around $4,300

Gold trades in positive above $4,300 after spending the first half of the day under bearish pressure. XAU/USD capitalizes on renewed USD weakness after the jobs report showed that the Unemployment Rate climbed to 4.6% in November and the PMI data revealed a loss of growth momentum in the private sector in December. 

US Retail Sales virtually unchanged at $732.6 billion in October

US Retail Sales virtually unchanged at $732.6 billion in October

Retail Sales in the United States were virtually unchanged at $732.6 billion in October, the US Census Bureau reported on Tuesday. This print followed the 0.1% increase (revised from 0.3%) recorded in September and came in below the market expectation of +0.1%.

Ukraine-Russia in the spotlight once again

Ukraine-Russia in the spotlight once again

Since the start of the week, gold’s price has moved lower, but has yet to erase the gains made last week. In today’s report we intend to focus on the newest round of peace talks between Russia and Ukraine, whilst noting the release of the US Employment data later on day and end our report with an update in regards to the tensions brewing in Venezuela.

RECOMMENDED LESSONS

5 Forex News Events You Need To Know

In the fast moving world of currency markets where huge moves can seemingly come from nowhere, it is extremely important for new traders to learn about the various economic indicators and forex news events and releases that shape the markets. Indeed, quickly getting a handle on which data to look out for, what it means, and how to trade it can see new traders quickly become far more profitable and sets up the road to long term success.

Top 10 Chart Patterns Every Trader Should Know

Chart patterns are one of the most effective trading tools for a trader. They are pure price-action, and form on the basis of underlying buying and selling pressure. Chart patterns have a proven track-record, and traders use them to identify continuation or reversal signals, to open positions and identify price targets.

7 Ways to Avoid Forex Scams

The forex industry is recently seeing more and more scams. Here are 7 ways to avoid losing your money in such scams: Forex scams are becoming frequent. Michael Greenberg reports on luxurious expenses, including a submarine bought from the money taken from forex traders. Here’s another report of a forex fraud. So, how can we avoid falling in such forex scams?

What Are the 10 Fatal Mistakes Traders Make

Trading is exciting. Trading is hard. Trading is extremely hard. Some say that it takes more than 10,000 hours to master. Others believe that trading is the way to quick riches. They might be both wrong. What is important to know that no matter how experienced you are, mistakes will be part of the trading process.

Strategy

Money Management

Psychology

Best Brokers of 2025