Kind Reminder:
In our introduction to yield curves, we noted that the idea behind the use of a Yield Curve is to measure investors’ perception of risk and future developments both in the bond market as well as in the overall economy. Short-term bonds should carry lower yields than longer-term ones because lending to someone for a shorter period of time is less risky for the investor. As such, Yield Curves should be positive.
This behaviour is referred to as the normal yield curve, which slopes upward from left to right on the graph as maturities lengthen and yields rise. This is the usual case in most instances throughout history.
However, there are times when the yield curve becomes steeper, inverted or flatter.
Inverted Yield Curve: In periods preceding recessions, the yield curve can actually invert, with short-term bonds offering higher yields than longer-term bonds. While this appears to be counterintuitive, there is a reason this makes sense: given that lower economic growth means lower yields then bond investors seek the safety of longer-term assets for their funds. As such, demand for these bonds increases and yields decline. Given that lower yields are associated with lower interest rates and lower interest rates are usually associated with slower economic growth, an inverted yield curve is often taken as a sign that the economy may soon stagnate.
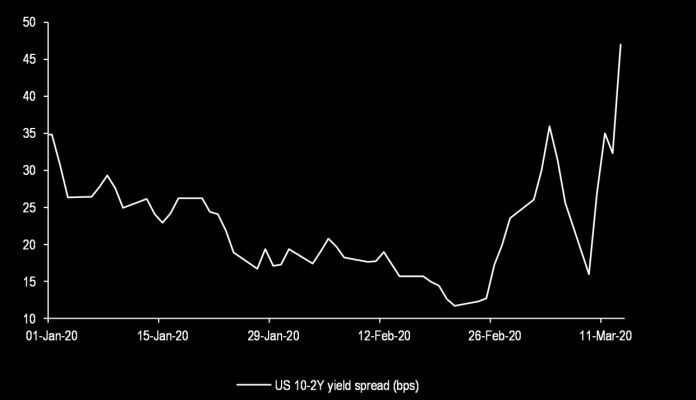
However, since the last few days we have seen is US but also in Europe bonds, composing a steep yield curve, we decided to have this article and podcast in order to explain the other two types of Yield curve.
Last night, Wall street continued to firm up on optimism the virus might be plateauing, or that at least that the worst has been seen. With that in mind, there’s increasing hope the lockdowns might be ended sooner rather than later. Stock markets post some gains while Treasuries were mixed. Hence, the long end continued to underperform and steepening the curve out to 50 bps. But what does a steep yield curve means?
Steep yield curve is when the difference between the long-term and short-term bonds becomes larger. This usually occurs at the beginning of a period of economic expansion, following the end of a recession. At that point, short-term interest rates will likely be very low given that the Central Bank has lowered them to fight the recession. However, as the economy begins to grow again, many people believe that inflation will also follow suit. At this point long-term bond investors fear that they will be locked into low rates as a result of the until-then depressed rates. As a result, they demand higher rates and only commit to their funds if the long-term bonds increase their yields.
A steepening yield curve typically indicates that investors expect rising inflation and stronger economic growth.
What is a Flat Yield Curve?
Flat yield curve meanwhile, is slightly the opposite of Steep Yield curve.
A flattening yield curve is when the difference between the long-term and short-term bonds becomes smaller and smaller – curve becomes less curvy -flat. At this point, investors demand higher long-term rates to make up for the lost value because inflation reduces the future value of an investment. A flattening yield curve can also occur in anticipation of slower economic growth. Sometimes the curve flattens when short-term rates rise on the expectation that the Central Bank will raise interest rates.
This happens because rising interest rates cause bond prices to go down—when fixed-rate bond prices fall, their yields rise.
Editors’ Picks

EUR/USD hits two-day highs near 1.1820
EUR/USD picks up pace and reaches two-day tops around 1.1820 at the end of the week. The pair’s move higher comes on the back of renewed weakness in the US Dollar amid growing talk that the Fed could deliver an interest rate cut as early as March. On the docket, the flash US Consumer Sentiment improves to 57.3 in February.

GBP/USD reclaims 1.3600 and above
GBP/USD reverses two straight days of losses, surpassing the key 1.3600 yardstick on Friday. Cable’s rebound comes as the Greenback slips away from two-week highs in response to some profit-taking mood and speculation of Fed rate cuts. In addition, hawkish comments from the BoE’s Pill are also collaborating with the quid’s improvement.

USD/JPY drops back below 157.00, as focus shifts to Japan snap election
USD/JPY is back in the red below 157.00 in the Asian session on Friday. The Japanese Yen recovers ground against the US Dollar amid some profit-taking ahead of Japan's snap general election on Sunday. The preliminary reading of the Michigan Consumer Sentiment Index report for February will be released later on Friday.
Editors’ Picks

EUR/USD: US Dollar to remain pressured until uncertainty fog dissipates Premium
The EUR/USD pair lost additional ground in the first week of February, settling at around 1.1820. The reversal lost momentum after the pair peaked at 1.2082 in January, its highest since mid-2021.

Gold: Volatility persists in commodity space Premium
After losing more than 8% to end the previous week, Gold (XAU/USD) remained under heavy selling pressure on Monday and dropped toward $4,400. Although XAU/USD staged a decisive rebound afterward, it failed to stabilize above $5,000.

GBP/USD: Pound Sterling tests key support ahead of a big week Premium
The Pound Sterling (GBP) changed course against the US Dollar (USD), with GBP/USD giving up nearly 200 pips in a dramatic correction.

Bitcoin: The worst may be behind us
Bitcoin (BTC) price recovers slightly, trading at $65,000 at the time of writing on Friday, after reaching a low of $60,000 during the early Asian trading session. The Crypto King remained under pressure so far this week, posting three consecutive weeks of losses exceeding 30%.

Three scenarios for Japanese Yen ahead of snap election Premium
The latest polls point to a dominant win for the ruling bloc at the upcoming Japanese snap election. The larger Sanae Takaichi’s mandate, the more investors fear faster implementation of tax cuts and spending plans.
RECOMMENDED LESSONS
Making money in forex is easy if you know how the bankers trade!
I’m often mystified in my educational forex articles why so many traders struggle to make consistent money out of forex trading. The answer has more to do with what they don’t know than what they do know. After working in investment banks for 20 years many of which were as a Chief trader its second knowledge how to extract cash out of the market.
5 Forex News Events You Need To Know
In the fast moving world of currency markets where huge moves can seemingly come from nowhere, it is extremely important for new traders to learn about the various economic indicators and forex news events and releases that shape the markets. Indeed, quickly getting a handle on which data to look out for, what it means, and how to trade it can see new traders quickly become far more profitable and sets up the road to long term success.
Top 10 Chart Patterns Every Trader Should Know
Chart patterns are one of the most effective trading tools for a trader. They are pure price-action, and form on the basis of underlying buying and selling pressure. Chart patterns have a proven track-record, and traders use them to identify continuation or reversal signals, to open positions and identify price targets.
7 Ways to Avoid Forex Scams
The forex industry is recently seeing more and more scams. Here are 7 ways to avoid losing your money in such scams: Forex scams are becoming frequent. Michael Greenberg reports on luxurious expenses, including a submarine bought from the money taken from forex traders. Here’s another report of a forex fraud. So, how can we avoid falling in such forex scams?
What Are the 10 Fatal Mistakes Traders Make
Trading is exciting. Trading is hard. Trading is extremely hard. Some say that it takes more than 10,000 hours to master. Others believe that trading is the way to quick riches. They might be both wrong. What is important to know that no matter how experienced you are, mistakes will be part of the trading process.
The challenge: Timing the market and trader psychology
Successful trading often comes down to timing – entering and exiting trades at the right moments. Yet timing the market is notoriously difficult, largely because human psychology can derail even the best plans. Two powerful emotions in particular – fear and greed – tend to drive trading decisions off course.