Combining COT and order flow indicators

Here at Littlefish FX, our whole trading ethos is centered around trying to trade in the same direction as the big fish: the Banks and major financial institutions. Whilst in the past, trading aspirations such as this would have been relatively impossible due to lack of information available to traders outside of these institutions, we now find ourselves at an incredibly interesting and exciting point, with market data, information and analytics creating opportunities for retail traders that have never before been seen.
With that in mind, we have designed what we believe to be some of the most consistent and profitable trading strategies available built around this central theme of using the available market data to trade in line with the big players instead of against them, a trap which many retail traders fall foul of.
These strategies comprise of using the Order Flow Indicators available on the Reuters Eikon trading software platform and our very own COT indicator (to be used on NinjaTrader 7) which automatically displays the information from the weekly Commitment of Traders report in a really effective visual format on your charts.
We have also developed an Order Flow Indicator package which can be used on Metastock Pro which is a professional market data & charting package, the LFX Order Flow Trader, which automatically generates trading signals for you based on a confluent crossover of the Psychology & Order Book Regression indicators.
Here is a quick look at a strategy combining both the COT indicators we built for NinjaTrader and the Order Flow Indicators we use on Eikon.
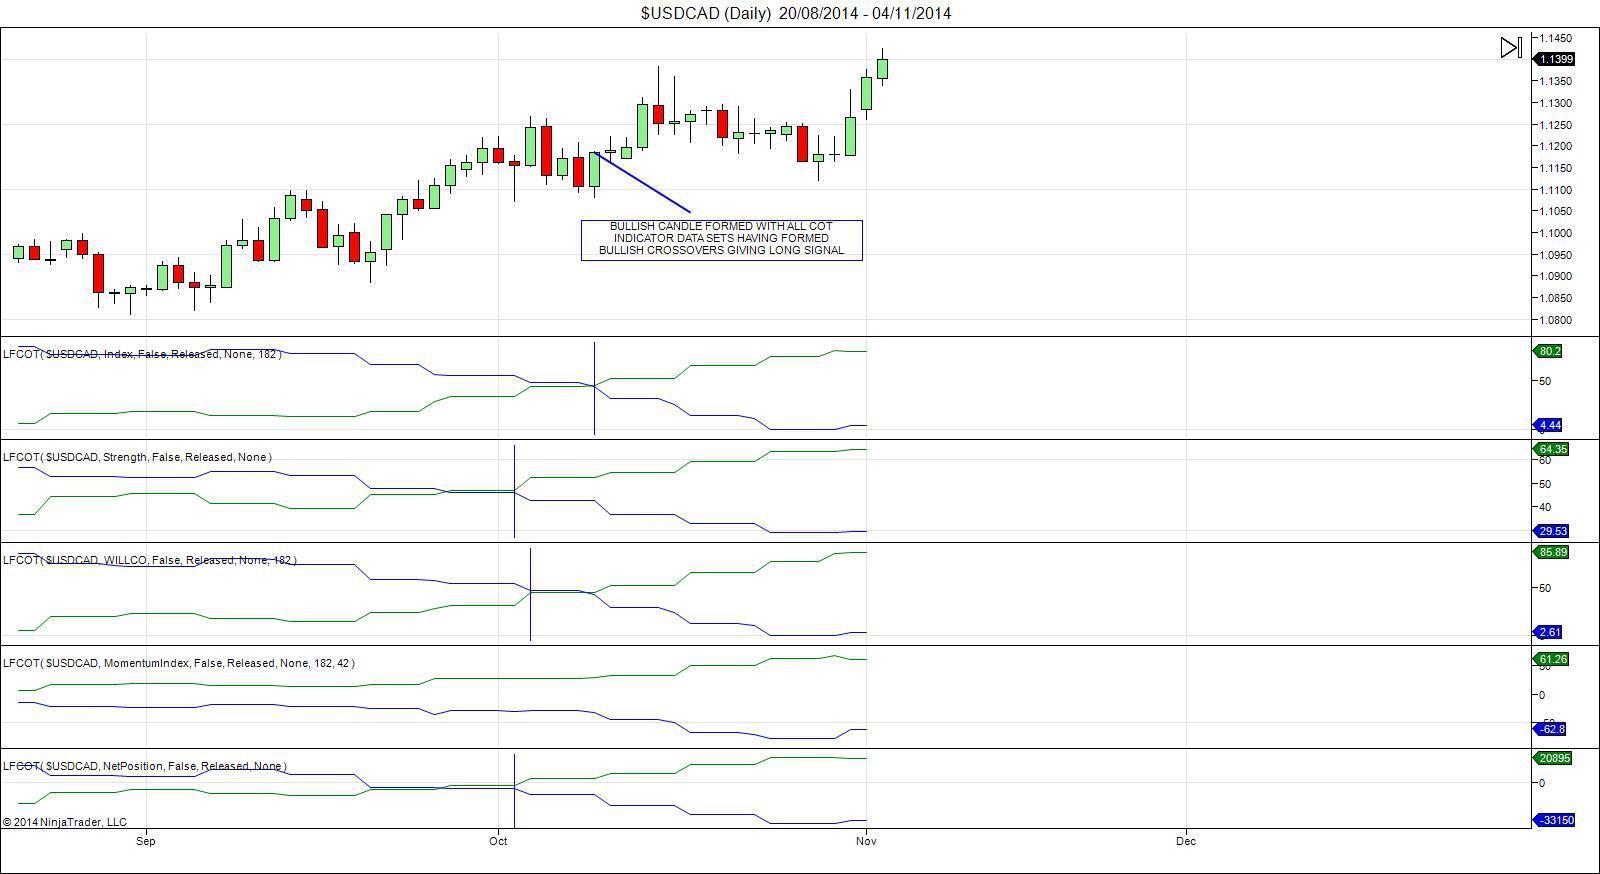
Looking at this USDCAD Daily chart we can see price beginning to trend higher from the September lows, whilst COT indicators remain to the downside (Green lines below blue). However, as price continues higher through early October, indicators begin to move to the upside and we then see bullish crossovers on Index, Strength, WILLCO & Net Positioning with Momentum moving steadily higher. With these crossovers in place we now have our Bullish trade signal, at which point we move across to our Eikon charts to look for entries using the Order Flow indicators.
_20160324083717-637973707808724631.png)
We can see that on the Bullish candle formed (which marked the final COT crossover on the Index indicator) both Psychology and Order Book Regression indicators crossed to the upside giving us our long trade entry.
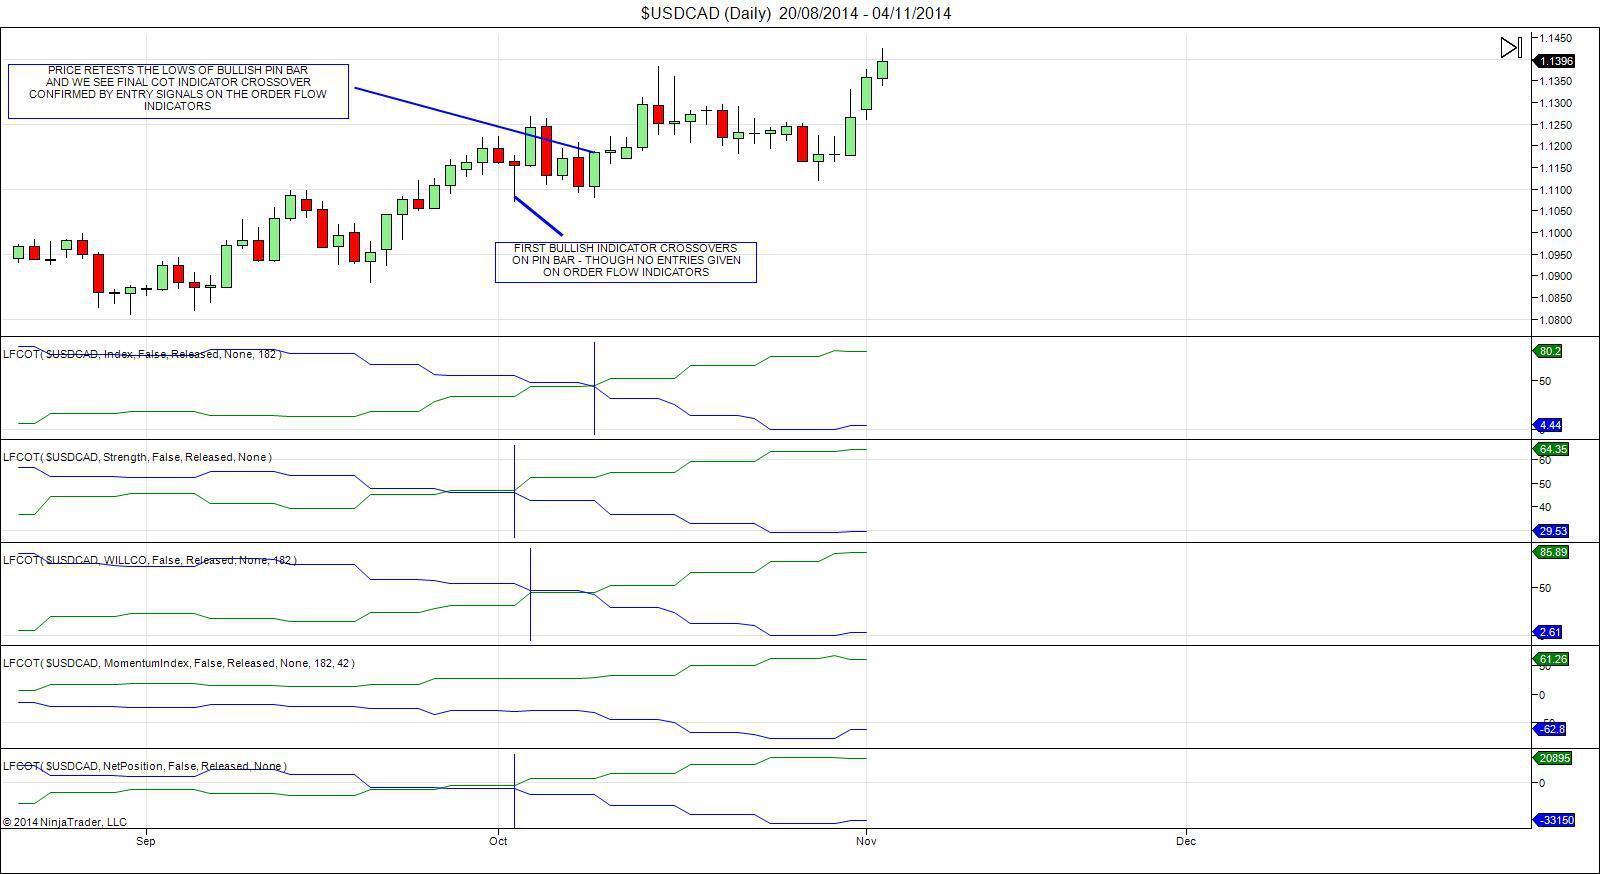
With COT indicators remaining at highs, keeping the bullish bias intact we can use the order flow indicators on lower timeframes to add to bullish positions.
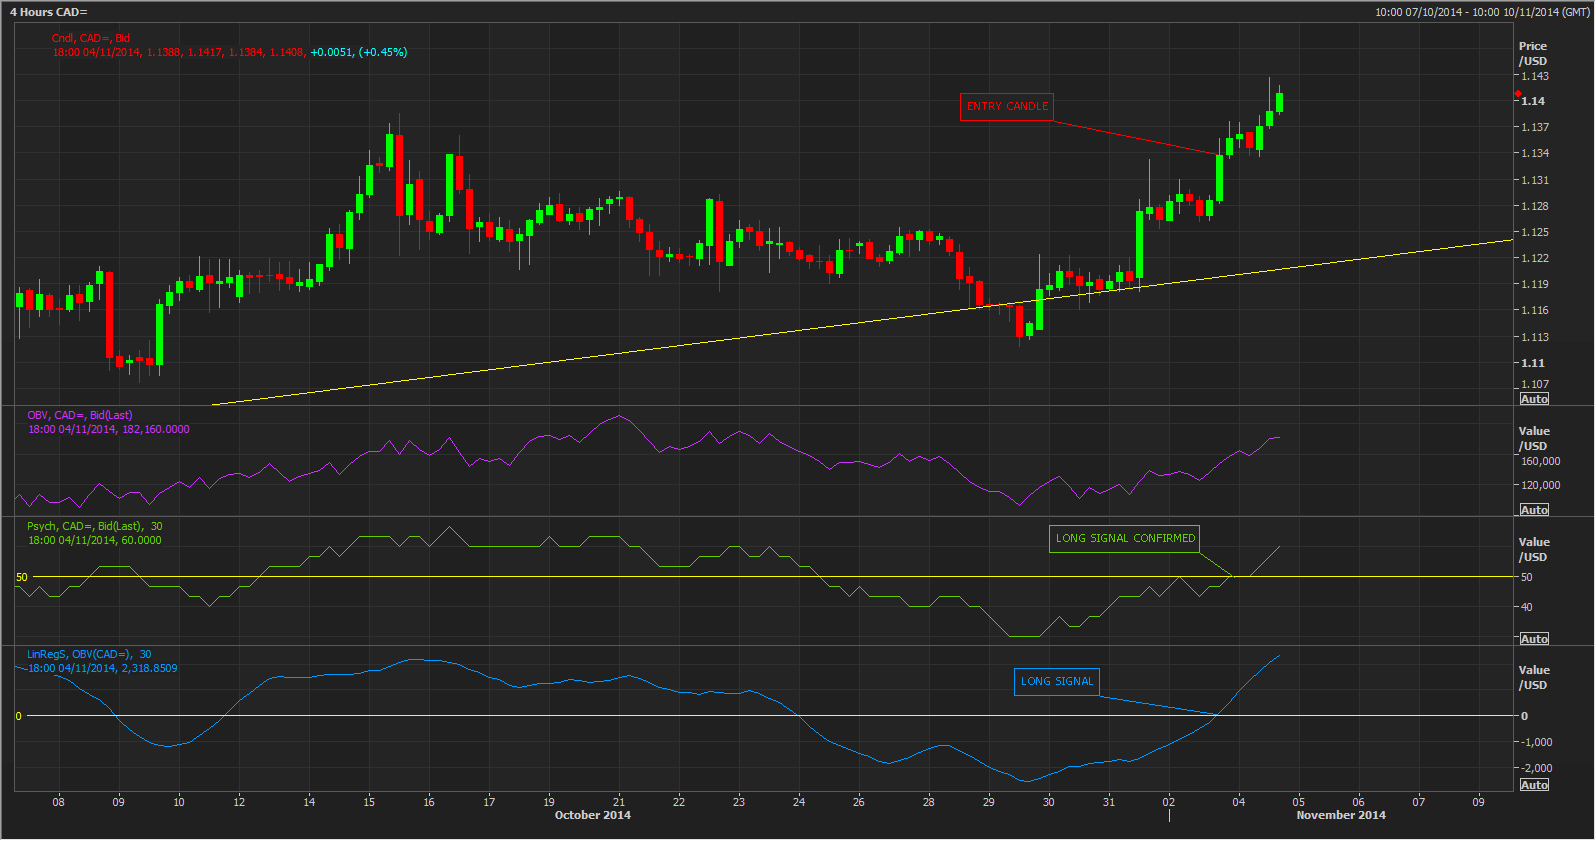
We can see here on the H4 chart that after price consolidated for a period shorty after our initial long position was established we then saw price breaking out to the upside. As this continued bullishness occurred we can see that Psychology & Order Book Regression indicators crossed to the upside giving us a signal to add to our core long position.
This is a very quick look at this combined strategy using both the COT indicators on NinjaTrade7 and the Order Flow indicators on Eikon, but the profitability of combining these tow indicators is evidently clear.
Author

James Harte, IMC
Orbex
James Harte is a Market Analyst and Content Author at Orbex with over eight years’ experience in analysing and trading currency markets.