![]() Russ Allen
Russ Allen
Online Trading Academy
As option traders, we must choose between competing opportunities for employing our finite trading funds. Part of the selection process has to involve calculating the likely return on investment. This is a little more challenging for option trades than it would be for single-dimensional instruments like stocks or futures, because option prices do not follow stock prices in a linear way. Still, with the right tools we can zero in on the metrics we need.
Consider the stock pictured in the chart below:
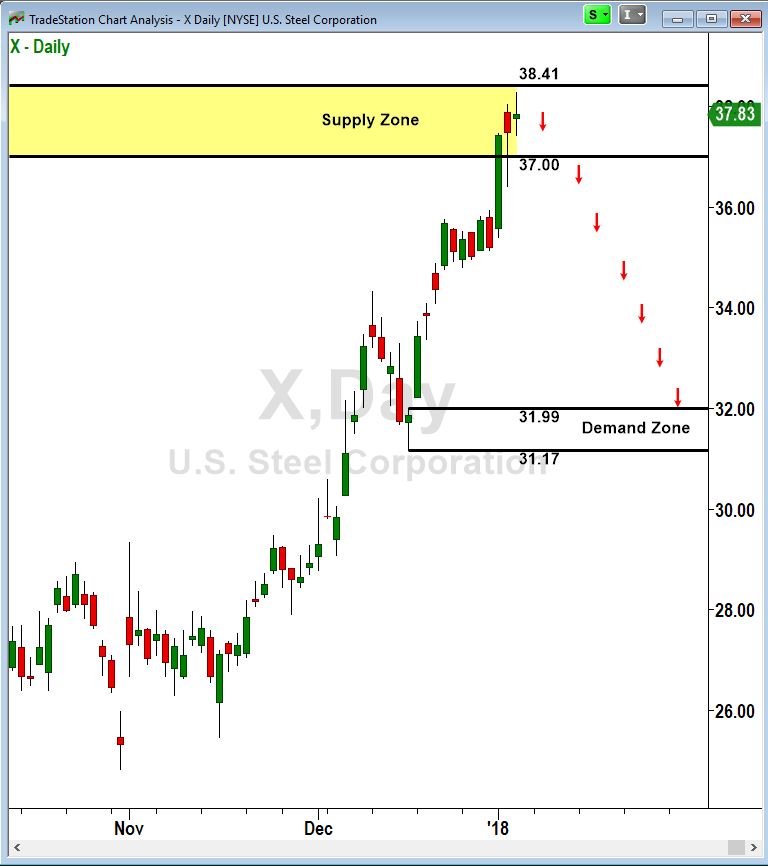
We believe (let’s say) that the most likely path for the price of the stock US Steel (X) is to reverse out of the supply zone it is currently in at around $38.00, and head down to the last major demand zone around $32.00. This trip took about six trading days last time it occurred in March 2017 (not shown on the chart), but we’ll allow a month to be safe.
The time period is important because the prices of options slowly go down over time through the process called time decay. That is a headwind that we have to take into account.
What we need to determine is:
-
how much we stand to make on an option trade if we are right about the trade
-
how much we stand to lose if we’re not
-
what our return on investment (ROI) will be if we do succeed on the trade.
First, let’s consider how we would make these calculations if we were to trade not the options, but the stock itself. We’ll use a 100-share lot to make calculations simple. Here is what the plan would be:
-
Sell short 100 shares of the stock when/if it drops down through the proximal (lower) line of our demand zone at 37.00. This movement would be the confirmation that the expected reversal has begun.
-
OR cancel the trade without entering it if X rises above the distal (upper) line of the demand zone at 38.41 before dropping below 37.00. In that case, our supply zone would have been proven not strong enough to reverse the direction and we would look for another opportunity. No harm, no foul.
-
Once in the trade, take profit by buying to cover the short position if/when the price of X drops to our target at 31.99.
-
On the other hand, if after we enter the trade and the price of X rises above our upper boundary at 38.41, we will exit the trade for a small loss. We’ll allow a bit of a buffer in case of a small excursion above the line, let’s say $.10. So, we’ll buy to cover the position if the price of X rises above 38.51.
Here is how this trade lays out (all figures are per share):
| Entry Price | $37.00 |
| Stop-loss Price | $38.51 |
| Loss if stopped out | $ 1.49 ($149 total on 100 shares) |
| Entry Price | $37.00 |
| Target Price | $31.99 |
| Gain if closed at target | $ 5.01 ($501 total on 100 shares) |
| Reward:Risk Ratio ($5.01 / $1.49) | 3.36 : 1 |
| Return on Investment ($5.01 / $37.00) | 13.54% |
So, the proposed trade offers a reward to risk ratio of over 3 to 1, and a return on investment of 13.54% if successful.
Now let’s consider this trade if using options instead of shares. First, let’s assume that instead of selling short 100 shares of stock, we bought one Put option at the next strike price just above our supply zone, which is the $39.00 strike. Each put option represents 100 shares of stock. We’ll use a put that expires several months out, say in April 2018.
The April $39.00 Put could be bought for $403 at this time. This put option technically gives us the right to sell 100 shares of X stock at $39.00 per share, any time between now and the close of business on April 18, 2018. We actually have no intention of exercising this option (after all, we have no shares of X to sell). Knowing that the value of put options goes up when the price of the stock goes down, our intention is to sell the put itself at a higher price than the $400 we paid for it. It is not necessary to own any shares of the stock on which you buy options.
If the price of X dropped to our $31.99 target, for example, the put would be worth at least the difference between $3199 (the cost at which one could buy 100 shares on the open market at that time), and $3900 (the price at which the $39 put gives us the guaranteed right to sell the shares at that time). This difference would be $3900 – $3199, or $701 minimum value of the put with the stock at our target. In fact, the put would be worth more than that $701 minimum (which is called its intrinsic value), depending on how much time was left in the put’s life when we wished to sell it. The longer it had to go, the more so-called time value it would have in addition to the $701 of intrinsic value.
But for starters, let’s say it was the very day of expiration by the time the price of X reached our $31.99 target. In that case, there would be no time value (no time left) and the put would be worth $701. Given that we paid $403 for the put originally, we would have a profit of $701 – $403 = $302. On a $403 investment, this is a rate of return of $302 / $403 or 75%.
If our target was hit earlier than the expiration day, then the put would retain more time value and we could sell it for a higher price and profit. For example, if the target was hit in a month, the value of the put is projected to be $755. This projection is done using an option P/L graph, which is a standard feature of most option trading platforms. I will describe the use of that tool in future articles.
Using that same P/L graph tool, we can project that if instead of dropping to our target, X hits our stop-loss price of $38.51 a month from now, the value of the put at that time would be $337. If that occurred, we would sell the put at that $337 price and take our relatively small loss.
We now have what we need to compare the two trades:
| Entry Price | $37.00 per share | $403 |
| Stop-loss Price | $38.51 | $337 |
| Loss if stopped out | $ 1.49 ($149 total on 100 shares) | $ 66 |
| Entry Price | $37.00 per share | $403 |
| Target Price | $38.51 | $753 |
| Gain if closed at target | $ 5.01 ($501 total on 100 shares) | $350 |
| Reward:Risk Ratio | 3.36 : 1 ($5.01 / $1.49) | 5.3 : 1 ($350 / $66) |
| Return on Investment | 13.54% ($5.01 / 37.00) | 86.8% ($350 / $403) |
On this trade, it is clear how the leverage inherent in options can increase our return on investment when we are right about the stock’s movement.
This example was simplified somewhat, ignoring bid-ask spreads, commissions and a couple of other factors for the sake of clarity. Our intention was to demonstrate the process of analyzing an option trade and how that compares to analyzing a stock trade. I hope you found it useful.
This content is intended to provide educational information only. This information should not be construed as individual or customized legal, tax, financial or investment services. As each individual's situation is unique, a qualified professional should be consulted before making legal, tax, financial and investment decisions. The educational information provided in this article does not comprise any course or a part of any course that may be used as an educational credit for any certification purpose and will not prepare any User to be accredited for any licenses in any industry and will not prepare any User to get a job. Reproduced by permission from OTAcademy.com click here for Terms of Use: https://www.otacademy.com/about/terms
Editors’ Picks

EUR/USD flirts with daily highs, retargets 1.1900
EUR/USD regains upside traction, returning to the 1.1880 zone and refocusing its attention to the key 1.1900 barrier. The pair’s slight gains comes against the backdrop of a humble decline in the US Dollar as investors continue to assess the latest US CPI readings and the potential Fed’s rate path.

GBP/USD remains well bid around 1.3650
GBP/USD maintains its upside momentum in place, hovering around daily highs near 1.3650 and setting aside part of the recent three-day drop. Cable’s improved sentiment comes on the back of the Greenback’s irresolute price action, while recent hawkish comments from the BoE’s Pill also collaborate with the uptick.

USD/JPY edges up above 153.50 with all eyes on US CPI figures
USD/JPY appreciates above 153.00 but remains on track for a 2.4% weekly loss. Trading volumes remain subdued on Friday, ahead of the IS CPI release. The Yen remains supported by hopes of a stable government and calls for further BoJ tightening.
Editors’ Picks

EUR/USD: Yes, the US economy is resilient – No, that won’t save the US Dollar Premium
Some impressive US data should have resulted in a much stronger USD. Well, it didn’t happen. The EUR/USD pair closed a third consecutive week little changed, a handful of pips above the 1.1800 mark.

Gold: Metals remain vulnerable to broad market mood Premium
Gold (XAU/USD) started the week on a bullish note and climbed above $5,000 before declining sharply and erasing its weekly gains on Thursday, only to recover heading into the weekend.

GBP/USD: Pound Sterling remains below 1.3700 ahead of UK inflation test Premium
The Pound Sterling (GBP) failed to resist at higher levels against the US Dollar (USD), but buyers held their ground amid a US data-busy blockbuster week.

Bitcoin: BTC bears aren’t done yet
Bitcoin (BTC) price slips below $67,000 at the time of writing on Friday, remaining under pressure and extending losses of nearly 5% so far this week.

US Dollar: Big in Japan Premium
The US Dollar (USD) resumed its yearly downtrend this week, slipping back to two-week troughs just to bounce back a tad in the second half of the week.
RECOMMENDED LESSONS
Making money in forex is easy if you know how the bankers trade!
I’m often mystified in my educational forex articles why so many traders struggle to make consistent money out of forex trading. The answer has more to do with what they don’t know than what they do know. After working in investment banks for 20 years many of which were as a Chief trader its second knowledge how to extract cash out of the market.
5 Forex News Events You Need To Know
In the fast moving world of currency markets where huge moves can seemingly come from nowhere, it is extremely important for new traders to learn about the various economic indicators and forex news events and releases that shape the markets. Indeed, quickly getting a handle on which data to look out for, what it means, and how to trade it can see new traders quickly become far more profitable and sets up the road to long term success.
Top 10 Chart Patterns Every Trader Should Know
Chart patterns are one of the most effective trading tools for a trader. They are pure price-action, and form on the basis of underlying buying and selling pressure. Chart patterns have a proven track-record, and traders use them to identify continuation or reversal signals, to open positions and identify price targets.
7 Ways to Avoid Forex Scams
The forex industry is recently seeing more and more scams. Here are 7 ways to avoid losing your money in such scams: Forex scams are becoming frequent. Michael Greenberg reports on luxurious expenses, including a submarine bought from the money taken from forex traders. Here’s another report of a forex fraud. So, how can we avoid falling in such forex scams?
What Are the 10 Fatal Mistakes Traders Make
Trading is exciting. Trading is hard. Trading is extremely hard. Some say that it takes more than 10,000 hours to master. Others believe that trading is the way to quick riches. They might be both wrong. What is important to know that no matter how experienced you are, mistakes will be part of the trading process.
The challenge: Timing the market and trader psychology
Successful trading often comes down to timing – entering and exiting trades at the right moments. Yet timing the market is notoriously difficult, largely because human psychology can derail even the best plans. Two powerful emotions in particular – fear and greed – tend to drive trading decisions off course.