![]() Sam Seiden
Sam Seiden
Independent Analyst
All market speculators share the same goal, which is to enjoy consistent low risk profits. To accomplish this goal, you must be able to identify market turning points and market moves as this is the only way to attain low risk and high reward entries into market (trading) positions. Whether you are a short term day trader or a longer term investor, nothing changes. Identifying key market turning points is the only way to attain the ideal risk/reward opportunity.
Leading Extended Learning Track (XLT) sessions for so long, I have come across many people in the program. Occasionally, I receive an email from a member that is not satisfied with their results and desires better returns. Most of the time they are not necessarily losing money, but they are not making money or not making enough money, and desire more. One of my first questions to them has to do with strategy. I ask them, “Do you have a plan and are you following that plan?” Half the time the answer is no so we dive into creating a proper plan and the importance of following that plan. The other half says they do have a plan and follow it much of the time. For this group my questions turn to the details of their plan; the strategy, where I look to see if their rules are proper or not. Sometimes there is a rule or two that is incorrect and the student doesn’t know this so we correct it. In my many years of experience, I have found that most of the time there is one specific and crucial rule that is missing from people’s plans more than any other, and that is the focus of this piece.
Before we discuss this rule and its importance, let’s first turn our attention back to market turning points. Price movement in any and all markets is a function of an ongoing demand and supply equation. Market prices turn at price levels where this simple and straightforward equation is out of balance. Therefore, price in any market turns at price levels where demand and supply are out of balance which means the strongest turns in price occur at price levels where demand and supply are most out of balance. So, the question for us is this: what exactly does this picture look like on a price chart?
When I ask students this question, they quickly describe the picture of demand that I have shown in articles for years, which is a “Drop – Base – Rally” (DBR) or “Rally – Base – Rally” (RBR). They then describe supply which is “Rally – Base – Drop” (RBD) or “Drop – Base – Drop” (DBD). These are the pictures that clearly show price levels where demand and supply are out of balance which is what we as market speculators are looking for. Next, students go right into their rules for entries, targets and stops. This is where I stop them as they are ignoring perhaps the most crucial rule that should be included in their trading plan. Drop – Base – Rally may be the picture of a price level where demand exceeds supply, a demand level. But, what EXACTLY is a demand level for you and your trading plan? I find that most people don’t quantify this with numbers. Quantifying exactly what “demand” (or supply) is to you and your plan is a key component to a trading plan that gives you an edge over other trading plans that don’t.
We have a number of “Odds Enhancers” at Online Trading Academy which are key to quantifying and identifying real demand and supply but those are beyond the scope of this article. To explain this further, we will however dive into the details of one of the most important Odds Enhancers. Let’s look at a recent trading example from our OTA Supply and Demand Grid.
OTA Supply Demand Crude Oil Trade Setup – Profit: $1,700
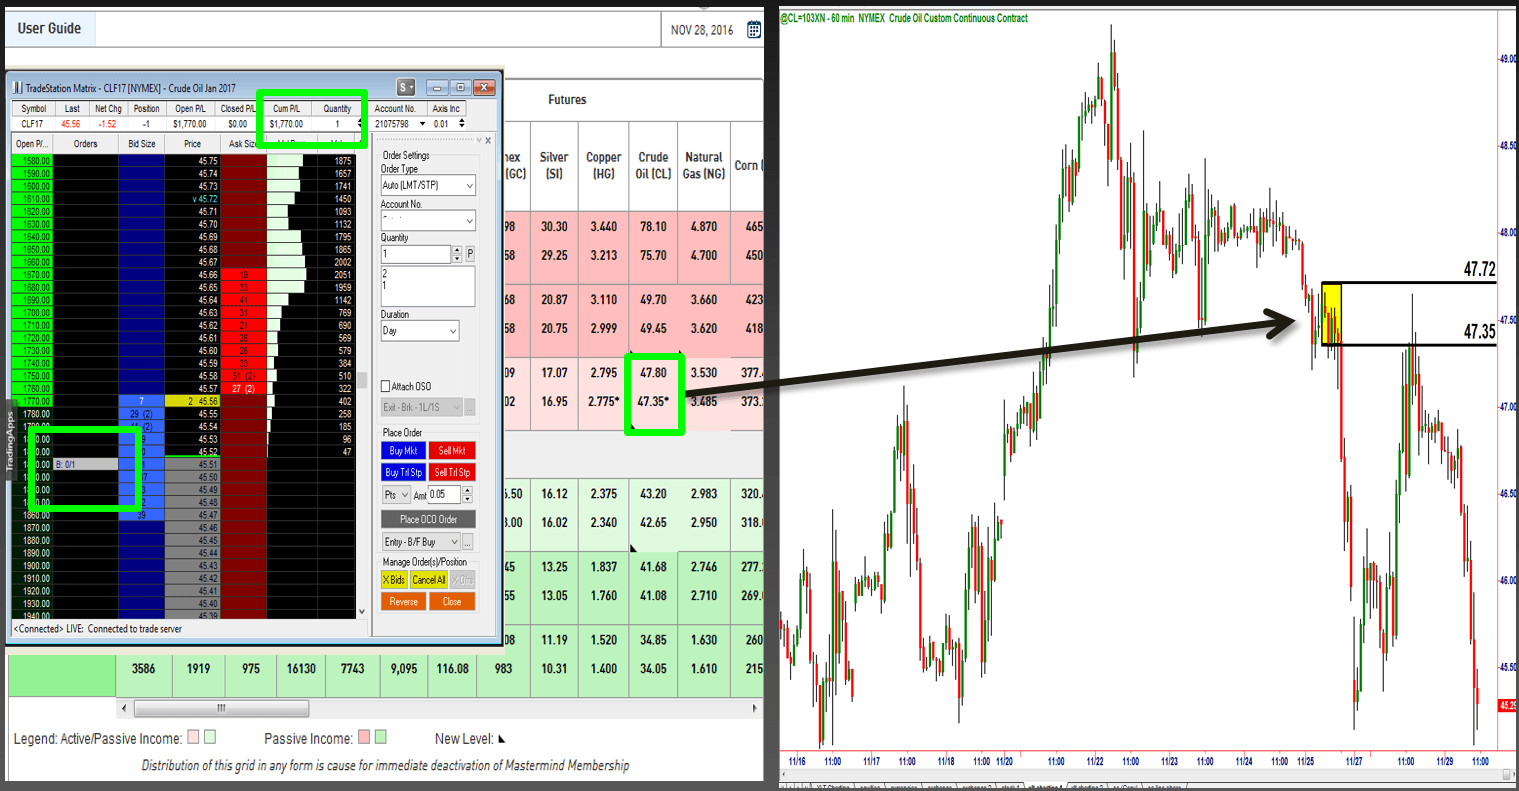
The chart above is Crude Oil. The supply level is a DBD coming out of a RBD. Just because it represents the pattern/picture we are looking for does not at all mean we have a low risk/high reward trading opportunity. One of the most important questions that comes next is whether there is a significant “profit zone” associated with this supply level or not; this is the key Odds Enhancer most overlook. The presence of a significant profit zone is key for two reasons. First, it helps quantify the risk and reward. Second, the larger the profit margin, the higher the probability. This is because a big profit zone means price is far from equilibrium and out at price levels where the demand and supply imbalances are largest.
The distance between the two black lines is the distance from our entry point to our protective stop loss price to manage risk. We sell short at the bottom black supply line and place our stop just above the upper black demand line. This helps measure our risk. The distance between our supply and target (prior low in this case) represents our potential profit zone or initial profit zone. Notice the strong rally that takes price up to supply for our short entry. That rally “opens up” a profit zone for us as we are willing sellers when price revisits that supply level which it did, offering us our short entry.
Back to our rule…
Rule: A level only becomes a level if the initial rally from the level is at least three times the level itself (1:3 Risk/Reward). Meaning, if the distance from entry to stop is two points in a market, the initial price move from that level has to be at least six points or it does not qualify as a level at all. I will ignore any levels that don’t meet this minimum requirement.
While we require a 1:3 as a minimum requirement for the supply level to actually meet the definition of a supply level, it may be different for you. You may require 1:4, or whatever. Personally, I am looking for even more than that. In this example, the chart was offering us more than our minimum requirement. What this suggested was the probability of price hitting our profit target was very likely. This does not mean that the target has to be at the bottom. It simply means that this opportunity is offering you more than what you are looking for and this will increase winning percentage if that is an important factor for you.
Price ended up reaching the target for a low risk and high reward trade. One of the most important factors for this successful trade was the length and speed of the initial decline away from the supply level combined with how price rallied back to the level, and this is a rule many market speculators fail to consider.
Many people talk about supply and demand when trading and writing trading plans. Few actually define what supply and demand levels really are. This is another step in building the edge required to get paid from your competition instead of paying them.
Hope this was helpful, have a great day.
Note: All information on this page is subject to change. The use of this website constitutes acceptance of our user agreement. Please read our privacy policy and legal disclaimer. Opinions expressed at FXstreet.com are those of the individual authors and do not necessarily represent the opinion of FXstreet.com or its management. Risk Disclosure: Trading foreign exchange on margin carries a high level of risk, and may not be suitable for all investors. The high degree of leverage can work against you as well as for you. Before deciding to invest in foreign exchange you should carefully consider your investment objectives, level of experience, and risk appetite. The possibility exists that you could sustain a loss of some or all of your initial investment and therefore you should not invest money that you cannot afford to lose. You should be aware of all the risks associated with foreign exchange trading, and seek advice from an independent financial advisor if you have any doubts.
Editors’ Picks

EUR/USD hits two-day highs near 1.1820
EUR/USD picks up pace and reaches two-day tops around 1.1820 at the end of the week. The pair’s move higher comes on the back of renewed weakness in the US Dollar amid growing talk that the Fed could deliver an interest rate cut as early as March. On the docket, the flash US Consumer Sentiment improves to 57.3 in February.

GBP/USD reclaims 1.3600 and above
GBP/USD reverses two straight days of losses, surpassing the key 1.3600 yardstick on Friday. Cable’s rebound comes as the Greenback slips away from two-week highs in response to some profit-taking mood and speculation of Fed rate cuts. In addition, hawkish comments from the BoE’s Pill are also collaborating with the quid’s improvement.

USD/JPY drops back below 157.00, as focus shifts to Japan snap election
USD/JPY is back in the red below 157.00 in the Asian session on Friday. The Japanese Yen recovers ground against the US Dollar amid some profit-taking ahead of Japan's snap general election on Sunday. The preliminary reading of the Michigan Consumer Sentiment Index report for February will be released later on Friday.
Editors’ Picks

EUR/USD: US Dollar to remain pressured until uncertainty fog dissipates Premium
The EUR/USD pair lost additional ground in the first week of February, settling at around 1.1820. The reversal lost momentum after the pair peaked at 1.2082 in January, its highest since mid-2021.

Gold: Volatility persists in commodity space Premium
After losing more than 8% to end the previous week, Gold (XAU/USD) remained under heavy selling pressure on Monday and dropped toward $4,400. Although XAU/USD staged a decisive rebound afterward, it failed to stabilize above $5,000.

GBP/USD: Pound Sterling tests key support ahead of a big week Premium
The Pound Sterling (GBP) changed course against the US Dollar (USD), with GBP/USD giving up nearly 200 pips in a dramatic correction.

Bitcoin: The worst may be behind us
Bitcoin (BTC) price recovers slightly, trading at $65,000 at the time of writing on Friday, after reaching a low of $60,000 during the early Asian trading session. The Crypto King remained under pressure so far this week, posting three consecutive weeks of losses exceeding 30%.

Three scenarios for Japanese Yen ahead of snap election Premium
The latest polls point to a dominant win for the ruling bloc at the upcoming Japanese snap election. The larger Sanae Takaichi’s mandate, the more investors fear faster implementation of tax cuts and spending plans.
RECOMMENDED LESSONS
Making money in forex is easy if you know how the bankers trade!
I’m often mystified in my educational forex articles why so many traders struggle to make consistent money out of forex trading. The answer has more to do with what they don’t know than what they do know. After working in investment banks for 20 years many of which were as a Chief trader its second knowledge how to extract cash out of the market.
5 Forex News Events You Need To Know
In the fast moving world of currency markets where huge moves can seemingly come from nowhere, it is extremely important for new traders to learn about the various economic indicators and forex news events and releases that shape the markets. Indeed, quickly getting a handle on which data to look out for, what it means, and how to trade it can see new traders quickly become far more profitable and sets up the road to long term success.
Top 10 Chart Patterns Every Trader Should Know
Chart patterns are one of the most effective trading tools for a trader. They are pure price-action, and form on the basis of underlying buying and selling pressure. Chart patterns have a proven track-record, and traders use them to identify continuation or reversal signals, to open positions and identify price targets.
7 Ways to Avoid Forex Scams
The forex industry is recently seeing more and more scams. Here are 7 ways to avoid losing your money in such scams: Forex scams are becoming frequent. Michael Greenberg reports on luxurious expenses, including a submarine bought from the money taken from forex traders. Here’s another report of a forex fraud. So, how can we avoid falling in such forex scams?
What Are the 10 Fatal Mistakes Traders Make
Trading is exciting. Trading is hard. Trading is extremely hard. Some say that it takes more than 10,000 hours to master. Others believe that trading is the way to quick riches. They might be both wrong. What is important to know that no matter how experienced you are, mistakes will be part of the trading process.
The challenge: Timing the market and trader psychology
Successful trading often comes down to timing – entering and exiting trades at the right moments. Yet timing the market is notoriously difficult, largely because human psychology can derail even the best plans. Two powerful emotions in particular – fear and greed – tend to drive trading decisions off course.