A Twist on Moving Averages

Hello traders! This week’s newsletter comes to you from snowy and sunny Colorado, where I have officially semi-retired. What does semi-retirement really mean? Well, I still get to write these newsletters every few weeks, and Online Trading Academy is still kind enough to get me around the country to cool towns to spread the gospel according to St. Market. If all I did was stay at home and trade in this snowy tundra, I would go stir crazy!
The reason I bring this up is that a couple of weeks ago I was in Boston, Massachusetts teaching one of our three-day Market Timing Orientation classes, and a student had an interesting question about conventional technical analysis.
His question was a common one: “What do you think about moving averages?” My answer was the same as it always is when someone asks about conventional technical analysis. “It depends. Does it help you or hurt you making money in the markets? Every ‘technique’ has its time and place, but most people don’t know how to use these tools properly.”
As we have discussed in previous newsletters, most of these indicators lag the market, which basically means they are late to the party. A couple of extremely basic rules of using moving averages, as found in all of the trading books ever written, is to go long when the moving averages are pointing up, when price hits the moving average; also, the trader should go short when the moving averages are pointing down, when price hits the moving average.
Fair enough, but let’s look at a chart to see how this would work in the real world. In the following USDJPY 30-minute chart on the left, I’ve marked an obvious supply zone and an obvious demand zone. (As a reminder, our core strategy states to sell in quality supply and buy in quality demand.) The chart on the left shows only a couple of the supply and demand levels for clarity sake. The chart on the right shows two common moving averages that some traders use, the 20 exponential and 50 exponential. For an in-depth explanation on these moving average see this article by Rick Wright.
The OTA student using our core strategy could have used the indicated supply to go short twice, once at the red arrow marked 1, a second time at the red arrow marked 2. (The original demand level is even farther back in time, but again, for clarity sake.) This same student could also have gone long at the demand level where the blue arrows are marked.
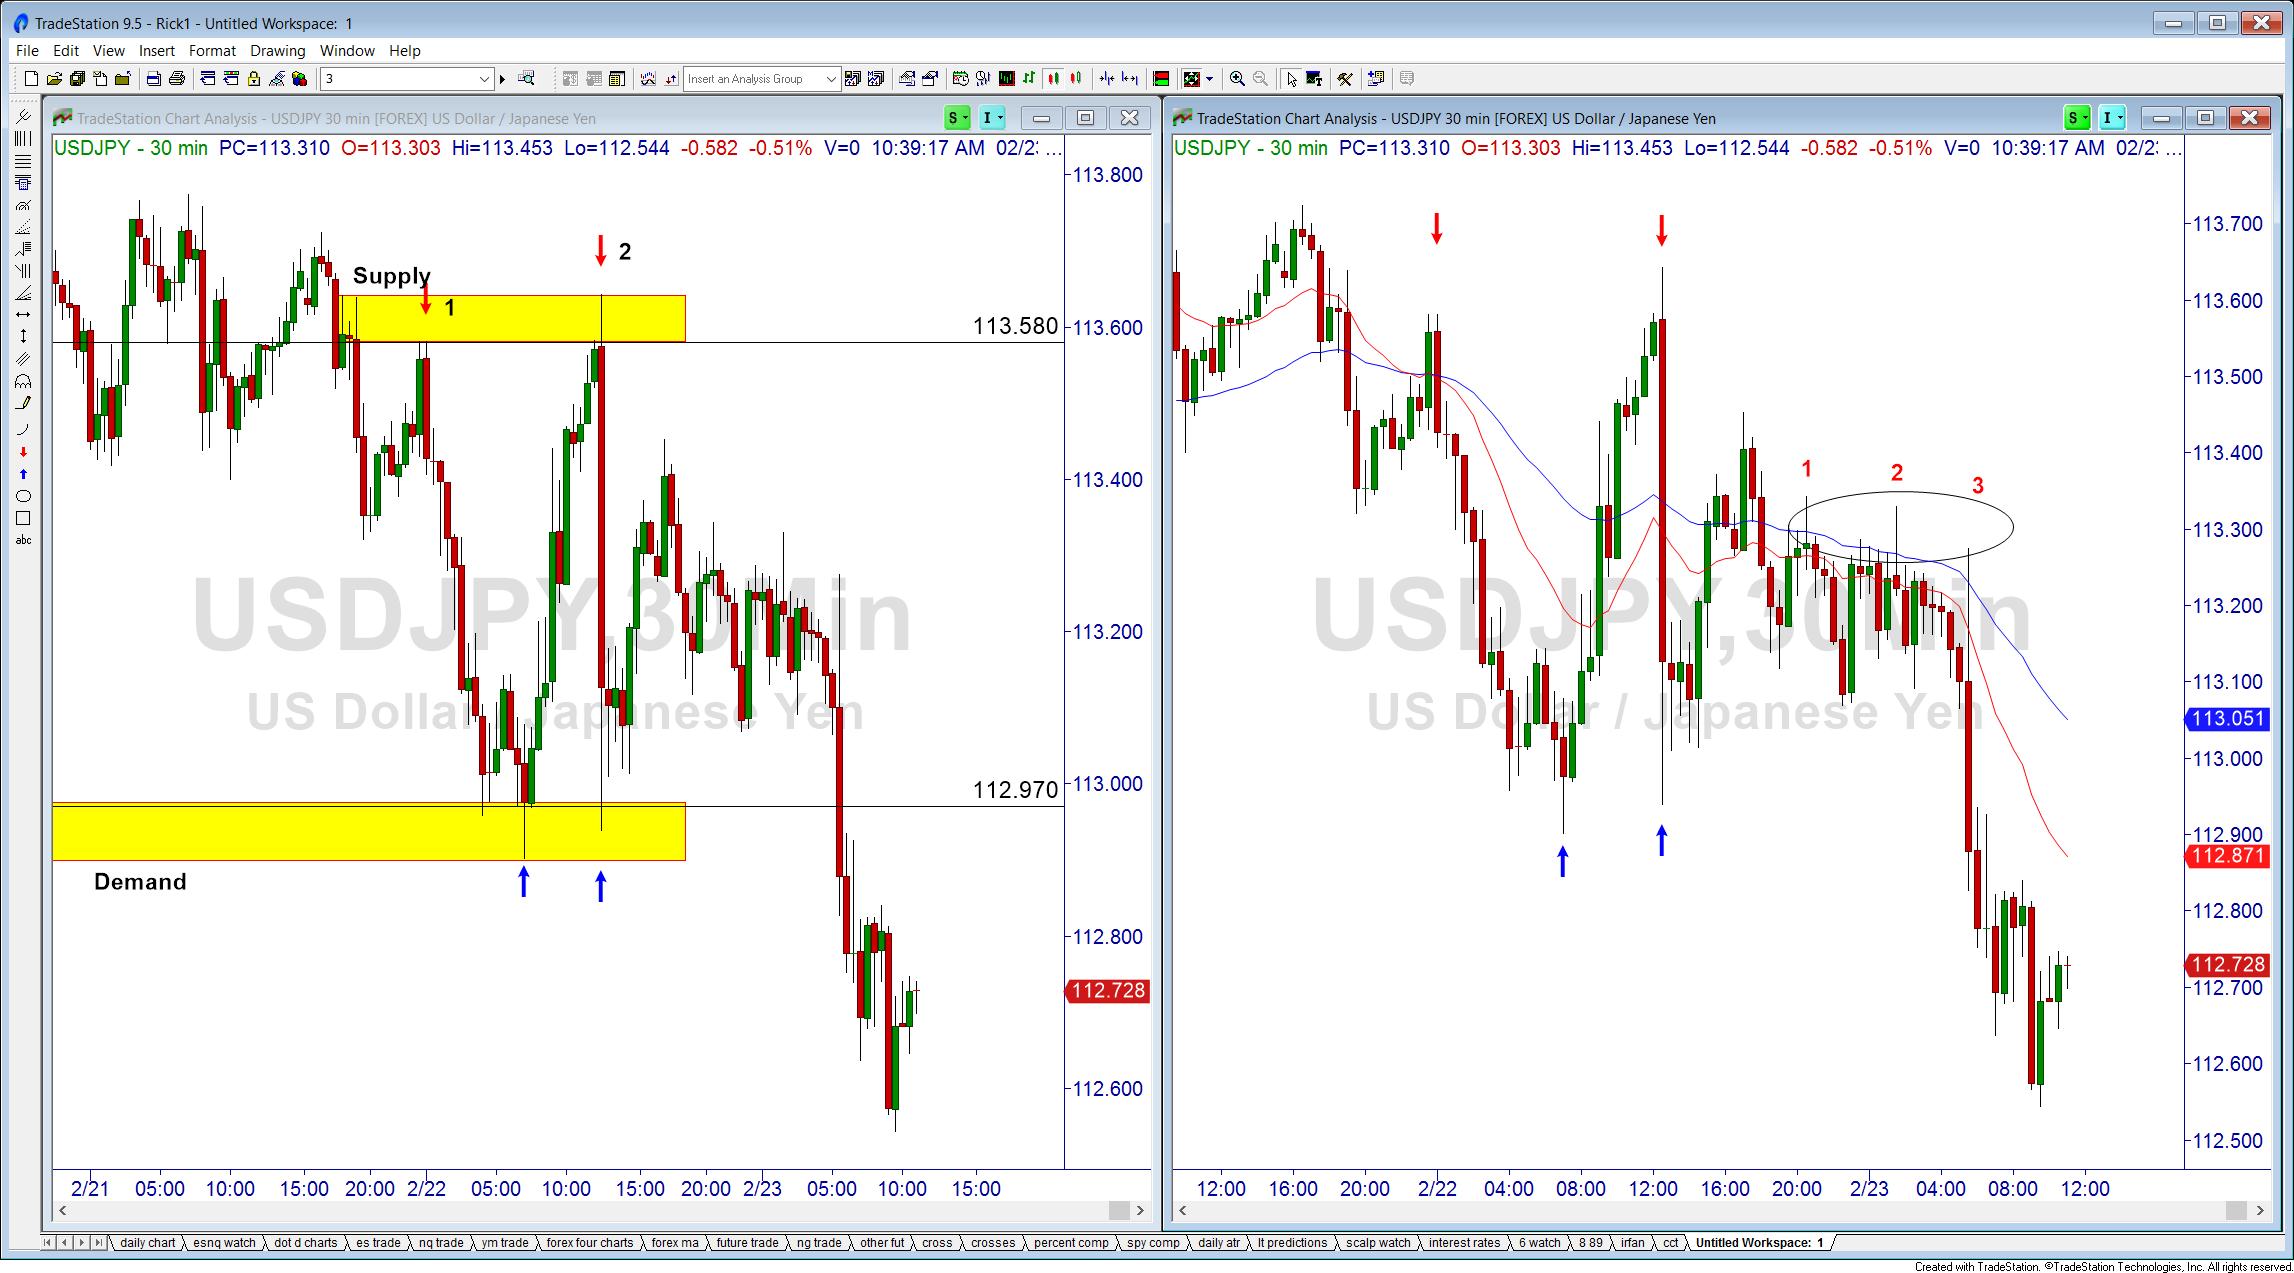
Notice where the red arrows are marked on the chart on the right. I haven’t seen a trading book yet that tells you to go short above a moving average like this! Now take a look at the blue arrows on the right-hand chart. How many trading books have you read that say to go long against the down-sloping moving averages? I would say none.
Let’s take this one step further. Using the rule mentioned earlier, some trading books suggest shorting when price moves up to the moving average. However, this only counts for the ENTRY. We also must be aware of our stop loss and profit target. Many trading book strategies tell you to place your stop loss just above the moving average that was used to enter the trade. Can you see a problem with this when looking at the red numbers 1, 2, and 3? Using that strategy, you would have been stopped out three times in a row! Not a great trading day…
So, the main take-away from this week’s newsletter should be this: all techniques have their time and place. But when and where are they? If you aren’t making money using them, they should obviously not be on your charts. Using supply and demand is the fastest way to get into and out of the market, when used with our entire core strategy.
Author

Rick Wright
Online Trading Academy
Rick studied economics and psychology at Iowa State University, and entered into the brokerage business in 1992. He earned the NASD Series 4,7,9,10,24,55,63, and 65 licenses. He helped grow an online brokerage business which was eventually sold off.


