![]() Markus Heitkoetter
Markus Heitkoetter
Rockwell Trading
Options Premium
Today I want to talk about options premium, what it is, and I’ll show you a very specific example.
Many people are struggling to understand how options premium work.
As you know, I have been selling puts recently during this the stock market crash and have been doing really well.
Now I want to show you exactly what I’m doing, and why I’m doing it.
Let’s get started.
SPCE Example
I want to use a specific example of SPCE, because that is an option that I’m currently trading.
And I want to show you exactly how it works.
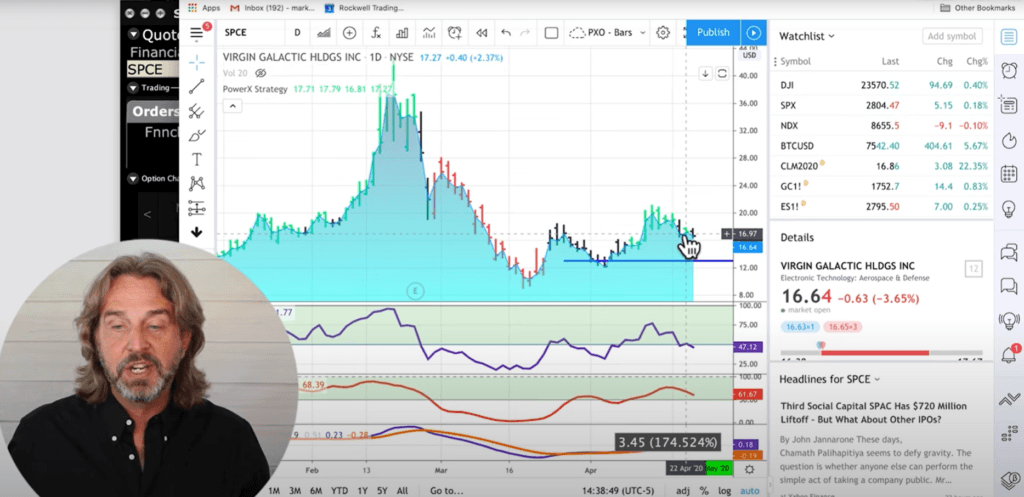
Let me first bring up the chart of SPCE. It’s Virgin Galactic.

You can see right now, the stock is trading at $16.65, this is the current price.
Now, I want to do two things.
First of all, we want to consider call option with a strike price of $18, and I also want to show you a strike price of let’s do $15.
You see the $16.65, the current price. When we buy a call option for $18, it means that now we can buy this stock for $18.
Now, why would that make sense if it is trading at $16.65? Of course, it doesn’t make sense.
So this is why the real value of this option is $0, right? Because at this point, why would you buy a stock for $18 if you could buy it for $16.65?
Now a strike price of $15 is a different story here.
So a strike price of $15 means that we can buy this stock for $15 if we have a $15 call. So this means the real value here is $1.65.
Why?
Because we could buy the stock for $15 and then sell it right away for $16.65.
Let’s move on and look at the…
Current option prices in the market that are happening right now
Here we are looking at an option chain for SPCE.
So right now we see that the $15 call, that expires in 15 days from now, is trading at $3 times $3.20. Let’s just say the current price is $3.
What does this mean?
Why is this option trading higher than just the $1.65 right now?
Well, because over the next 15 days, the stock might move much higher.
So as you can see, there’s a difference, and the difference is what we call the time value.
So the time value is the difference between $3 and $1.65, so that’s $1.35.
What does this time value mean?
Well, this is where traders are expecting that this stock might move even higher over the next 15 days.
Now this premium, this time value, will disappear day by day. And we’ll talk about this in just a moment.
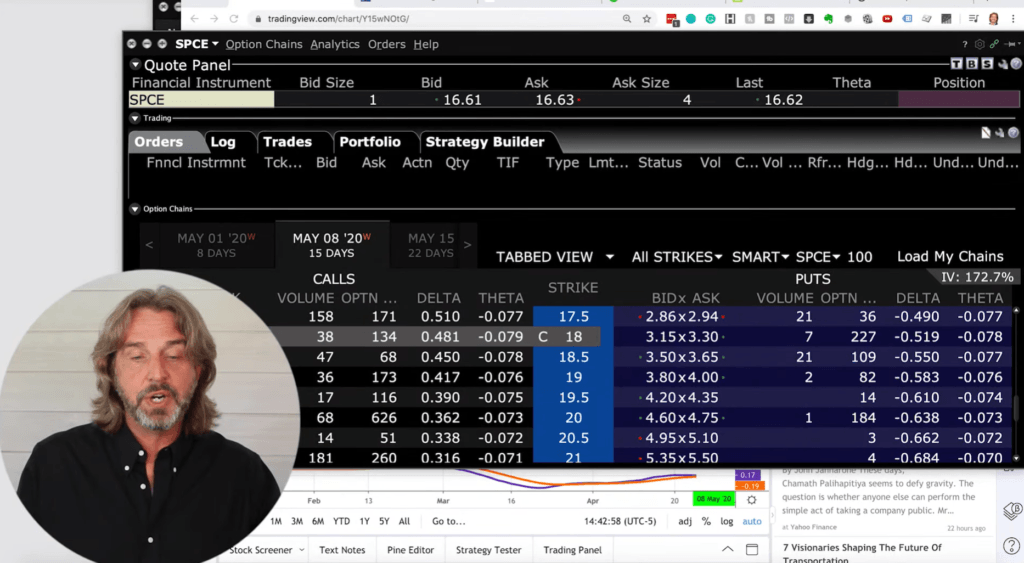
So as you can see, the $18 call is trading at $1.74 over $1.83. In order for us to make it easy, let’s say the current price is $1.80.
What does this mean?
Since there’s no real value in there at all, it means that the time value of this option is $1.80.
Now, just looking at these two options, which time value is higher?
Well, obviously, the $18 Call Option. The option that is out of the money, that has no real value yet.
Now I want to do it the other way around and show you a put option example so you know exactly why I like to sell premium.
Put Example
We’re using an example for a put. Again, we are drawing some basics here on the chart.
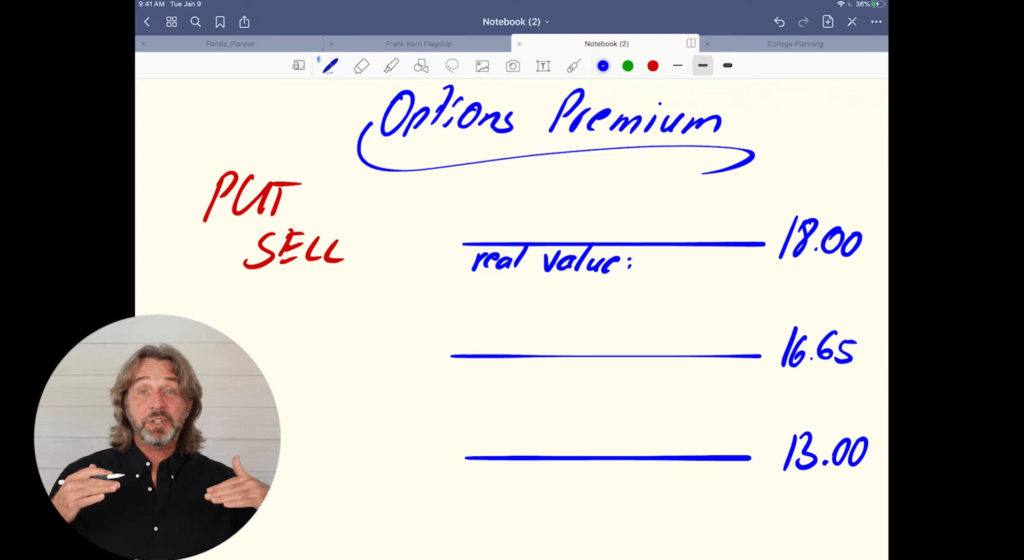
Right now we are trading at $16.65.
Now let’s take a look at two puts, one put of let’s say $18, and we will take a look at a put that is trading at $13 because that is the put that I currently have.
You saw previously that we can buy the stock. So call means that we can buy the stock at the strike price.
When we talk about puts, it means that we can sell the stock at the price.
If the stock is trading at $16.65, and we can sell it at $18, what is the real value of this option?
It doesn’t have real value, think about it. It’s trading at $16.65, and if we could sell it right now at a higher price of $18, our profit would be $1.35.
Making sense?
Now, also, for the $13 put, if the market is trading right now at $16.65 and we could sell the stock for $13, would that make sense?
No, we would lose money, so this is why here the real value is $0.
Let’s look at the current price and the time value.
Let’s jump onto the platform and take a look.
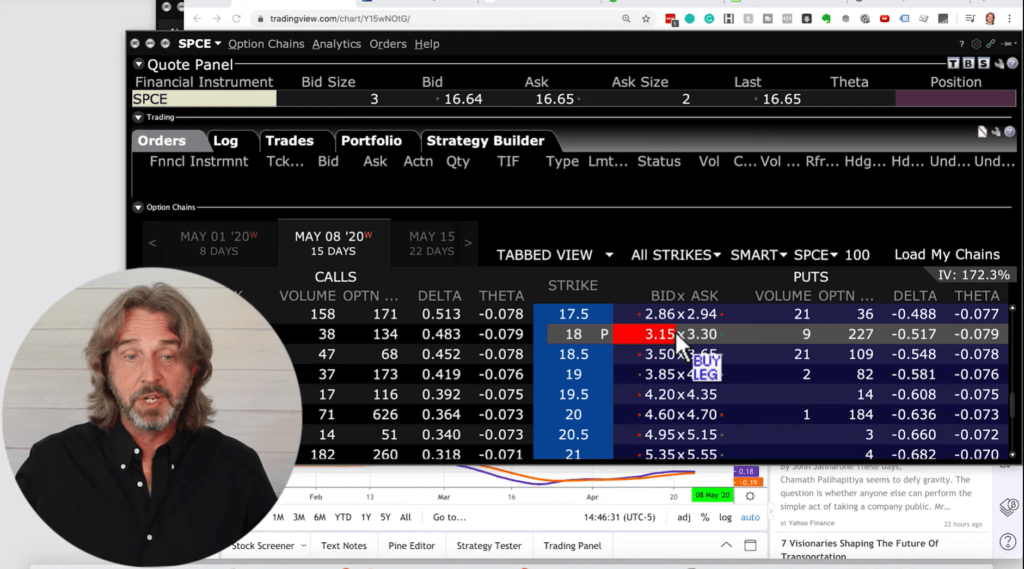
Now we are looking at an $18 put, and you see that right now the put is at $3.15 over $3.30. Now let’s just say the current price is $3.35 to make it easy.
So this means that the time value here is $2.
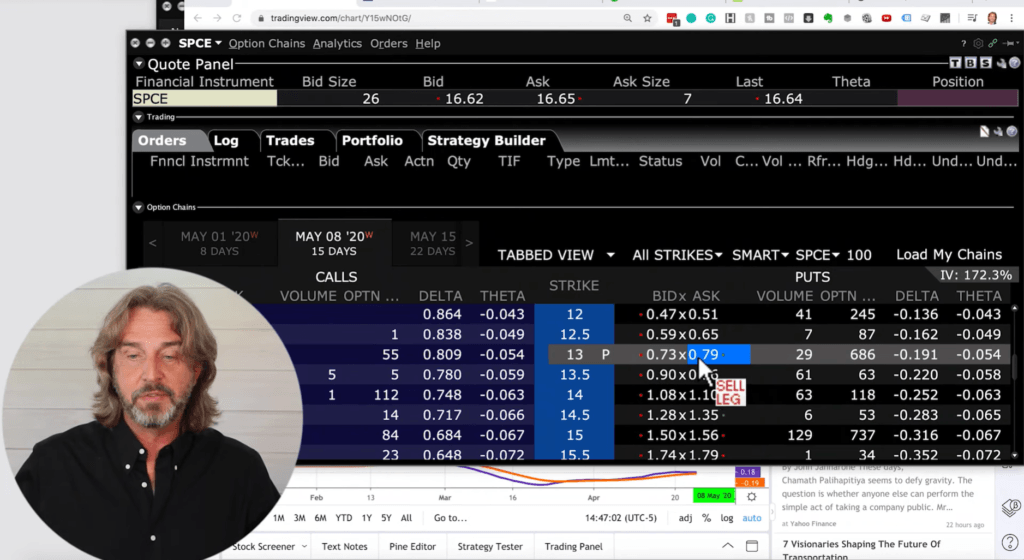
And now we’re also looking at the current price for the $13 put, let’s say it’s $0.75. $0.73 over $0.79, $0.75.
And since the real value is nothing, it means that the time value is $0.75.
Now here’s the deal with this time value. Let me just show it to you on this chart.
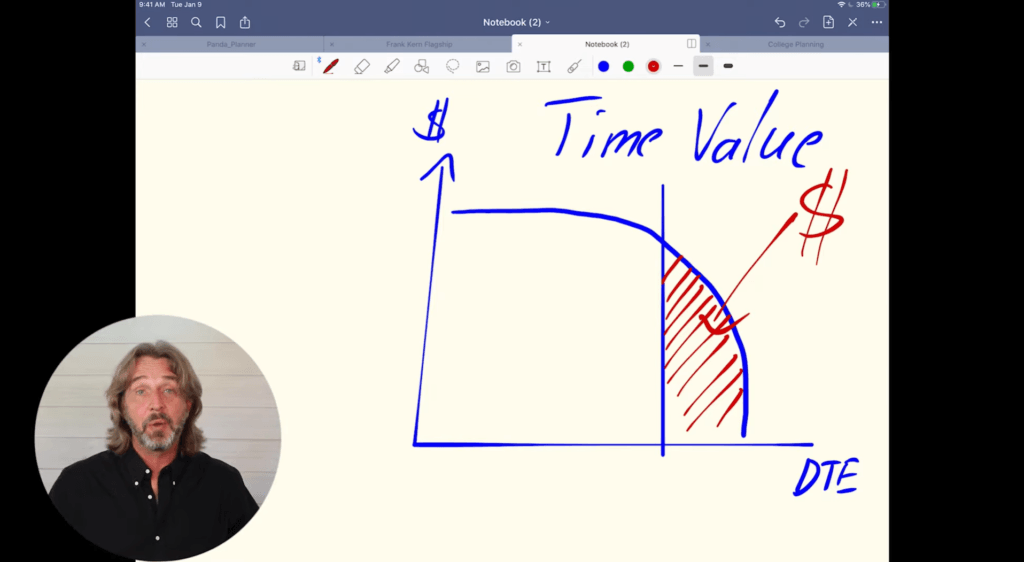
Here you see that the time value actually goes down over time. What you see here is the DTE, that’s the days to expiration, and this here is the dollar sign.
You see in the last 30 days this is when we see that the time value is decreasing quite quickly.
So this is when we talk about the time value, and this is exactly where right now I can make money when I’m selling options.
Recap
I know this is a very quick introduction, but it is super important that you understand that an option price always consists of two things.
The real value and the time value.
And when we are selling options, what we want to take advantage of is the time value.
I hope this helps you better understand what options premium is and when it makes sense to buy options and when it makes sense to sell options.
Trading Futures, options on futures and retail off-exchange foreign currency transactions involves substantial risk of loss and is not suitable for all investors. You should carefully consider whether trading is suitable for you in light of your circumstances, knowledge, and financial resources. You may lose all or more of your initial investment. The lower the day trade margin, the higher the leverage and riskier the trade. Leverage can work for you as well as against you; it magnifies gains as well as losses. Past performance is not necessarily indicative of future results.
Editors’ Picks

EUR/USD hits two-day highs near 1.1820
EUR/USD picks up pace and reaches two-day tops around 1.1820 at the end of the week. The pair’s move higher comes on the back of renewed weakness in the US Dollar amid growing talk that the Fed could deliver an interest rate cut as early as March. On the docket, the flash US Consumer Sentiment improves to 57.3 in February.

GBP/USD reclaims 1.3600 and above
GBP/USD reverses two straight days of losses, surpassing the key 1.3600 yardstick on Friday. Cable’s rebound comes as the Greenback slips away from two-week highs in response to some profit-taking mood and speculation of Fed rate cuts. In addition, hawkish comments from the BoE’s Pill are also collaborating with the quid’s improvement.

USD/JPY drops back below 157.00, as focus shifts to Japan snap election
USD/JPY is back in the red below 157.00 in the Asian session on Friday. The Japanese Yen recovers ground against the US Dollar amid some profit-taking ahead of Japan's snap general election on Sunday. The preliminary reading of the Michigan Consumer Sentiment Index report for February will be released later on Friday.
Editors’ Picks

EUR/USD: US Dollar to remain pressured until uncertainty fog dissipates Premium
The EUR/USD pair lost additional ground in the first week of February, settling at around 1.1820. The reversal lost momentum after the pair peaked at 1.2082 in January, its highest since mid-2021.

Gold: Volatility persists in commodity space Premium
After losing more than 8% to end the previous week, Gold (XAU/USD) remained under heavy selling pressure on Monday and dropped toward $4,400. Although XAU/USD staged a decisive rebound afterward, it failed to stabilize above $5,000.

GBP/USD: Pound Sterling tests key support ahead of a big week Premium
The Pound Sterling (GBP) changed course against the US Dollar (USD), with GBP/USD giving up nearly 200 pips in a dramatic correction.

Bitcoin: The worst may be behind us
Bitcoin (BTC) price recovers slightly, trading at $65,000 at the time of writing on Friday, after reaching a low of $60,000 during the early Asian trading session. The Crypto King remained under pressure so far this week, posting three consecutive weeks of losses exceeding 30%.

Three scenarios for Japanese Yen ahead of snap election Premium
The latest polls point to a dominant win for the ruling bloc at the upcoming Japanese snap election. The larger Sanae Takaichi’s mandate, the more investors fear faster implementation of tax cuts and spending plans.
RECOMMENDED LESSONS
Making money in forex is easy if you know how the bankers trade!
I’m often mystified in my educational forex articles why so many traders struggle to make consistent money out of forex trading. The answer has more to do with what they don’t know than what they do know. After working in investment banks for 20 years many of which were as a Chief trader its second knowledge how to extract cash out of the market.
5 Forex News Events You Need To Know
In the fast moving world of currency markets where huge moves can seemingly come from nowhere, it is extremely important for new traders to learn about the various economic indicators and forex news events and releases that shape the markets. Indeed, quickly getting a handle on which data to look out for, what it means, and how to trade it can see new traders quickly become far more profitable and sets up the road to long term success.
Top 10 Chart Patterns Every Trader Should Know
Chart patterns are one of the most effective trading tools for a trader. They are pure price-action, and form on the basis of underlying buying and selling pressure. Chart patterns have a proven track-record, and traders use them to identify continuation or reversal signals, to open positions and identify price targets.
7 Ways to Avoid Forex Scams
The forex industry is recently seeing more and more scams. Here are 7 ways to avoid losing your money in such scams: Forex scams are becoming frequent. Michael Greenberg reports on luxurious expenses, including a submarine bought from the money taken from forex traders. Here’s another report of a forex fraud. So, how can we avoid falling in such forex scams?
What Are the 10 Fatal Mistakes Traders Make
Trading is exciting. Trading is hard. Trading is extremely hard. Some say that it takes more than 10,000 hours to master. Others believe that trading is the way to quick riches. They might be both wrong. What is important to know that no matter how experienced you are, mistakes will be part of the trading process.
The challenge: Timing the market and trader psychology
Successful trading often comes down to timing – entering and exiting trades at the right moments. Yet timing the market is notoriously difficult, largely because human psychology can derail even the best plans. Two powerful emotions in particular – fear and greed – tend to drive trading decisions off course.