EUR/USD Elliott Wave technical analysis [Video]
![EUR/USD Elliott Wave technical analysis [Video]](https://editorial.fxstreet.com/images/Markets/Currencies/Majors/EURUSD/money-euro-and-dollar-banknotes-17371247_XtraLarge.jpg)
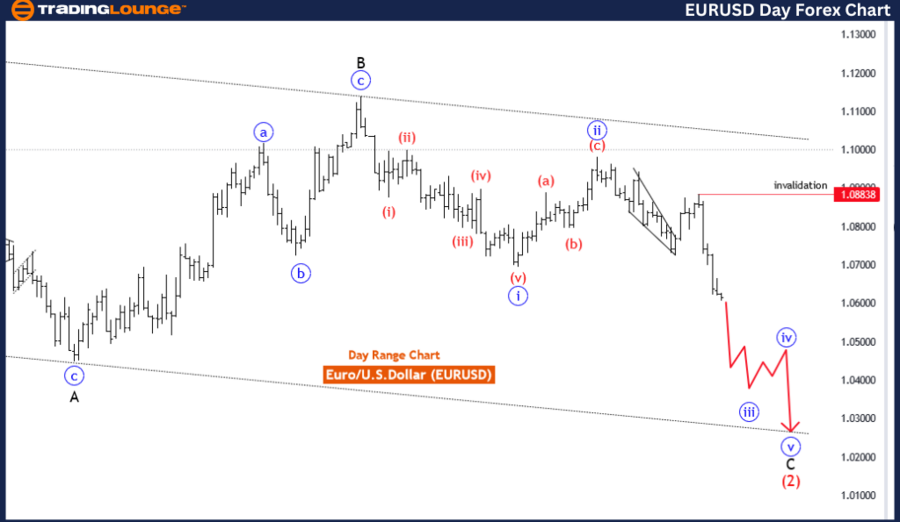
EURUSD Elliott Wave Analysis Trading Lounge Day Chart,
Euro/U.S.Dollar(EURUSD) Day Chart.
EUR/USD Elliott Wave technical analysis
Function: Counter Trend.
Mode: impulsive as C.
Sturcture: Blue wave 3.
Position: Black wave C of 2.
Direction next higher degrees: Blue wave 4.
Details: Blue wave 2 looking completed at 1.09862 .Now blue wave 3 of C is in play . Wave Cancel invalid level: 1.08838.
The EUR/USD Elliott Wave Analysis for the day chart offers insights into the potential price movements of the Euro against the U.S. Dollar, applying Elliott Wave principles for technical analysis.
Described as a "Counter Trend," the analysis suggests that the current market direction is contrary to the prevailing trend. This indicates that the EUR/USD pair may be undergoing a temporary reversal against the broader uptrend.
Identified as "Impulsive as C" in mode, the analysis indicates that the current market movement exhibits characteristics of an impulsive wave within the larger corrective pattern labeled as "C." This suggests a strong and sustained directional move against the primary trend.
The "STRUCTURE" is labeled as "blue wave 3," providing clarity on the current wave count within the Elliott Wave cycle. This assists traders in understanding the ongoing impulsive movement and its alignment with the broader corrective structure labeled as "C."
Positioned as "black wave C of 2," the analysis highlights the specific phase of the corrective pattern within the larger Elliott Wave cycle. This suggests that the market is currently undergoing a corrective phase within the context of the broader countertrend move.
In the "DIRECTION NEXT HIGHER DEGREES" section, the analysis mentions "blue wave 4," indicating the anticipated direction for the subsequent higher-degree wave within the corrective pattern. This suggests that the market may experience a temporary pullback following the completion of the current impulsive wave.
The "DETAILS" section notes that "blue wave 2 looking completed at 1.09862. Now blue wave 3 of C is in play." This suggests that the previous corrective wave has likely concluded, and the market is now in the third wave of the current impulsive movement. Traders may monitor this wave for potential trading opportunities or trend continuation. Additionally, the wave cancel level is noted at 1.08838, serving as a reference point for invalidating the wave count.
EUR/USD Elliott Wave technical analysis
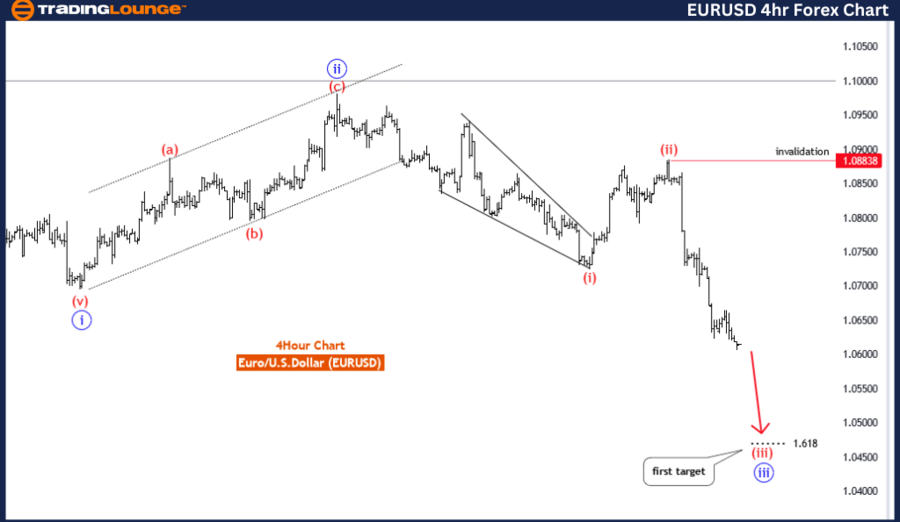
Function: Trend.
Mode: Impulsive.
Structure: Red wave 3.
Position: Blue wave 3.
Direction next higher degrees: Red wave 4.
Details: Red wave 2 looking completed at 1.08838. Now red wave 3 of 3 is in play. Wave Cancel invalid level: 1.08838.
The EUR/USD Elliott Wave Analysis for the 4-hour chart provides insights into the potential price movements of the Euro against the U.S. Dollar, utilizing Elliott Wave principles for technical analysis.
Described as a "Trend," the analysis indicates that the prevailing market direction aligns with the broader uptrend in the EUR/USD pair. This suggests that the current price action is consistent with the dominant bullish momentum in the market.
Identified as "Impulsive" in mode, the analysis suggests that the current market movement exhibits characteristics of an impulsive wave, indicating a strong and sustained directional move. Traders may interpret this as a sign of significant buying or selling pressure driving the market in one direction.
The "STRUCTURE" is characterized as "red wave 3," providing clarity on the current wave count within the Elliott Wave cycle. This assists traders in understanding the ongoing impulsive movement and its alignment with the broader Elliott Wave structure.
Positioned as "blue wave 3," the analysis highlights the specific phase of the impulsive wave within the larger Elliott Wave cycle. This suggests that the market is currently experiencing a strong upward movement within the context of the broader uptrend.
In the "DIRECTION NEXT HIGHER DEGREES" section, the analysis mentions "red wave 4," indicating the anticipated direction for the subsequent higher-degree wave within the impulsive pattern. This suggests that the market may experience a corrective phase following the completion of the current impulsive wave.
The "DETAILS" section mentions that "red wave 2 looking completed at 1.08838. Now red wave 3 of 3 is in play." This suggests that the previous corrective wave has likely concluded, and the market is now in the third wave of the current impulsive movement. Traders may monitor this wave for potential trading opportunities or trend continuation.
EUR/USD Elliott Wave technical analysis [Video]
Author

Peter Mathers
TradingLounge
Peter Mathers started actively trading in 1982. He began his career at Hoei and Shoin, a Japanese futures trading company.


