Zilliqa Price Forecast: ZIL bulls maintain control, next stop $0.0065
- Zilliqa price extends gains on Wednesday, after surging more than 13% in the previous two days.
- On-chain and derivatives data support bullish sentiment, with trading volume and open interest rising alongside positive funding rates.
- Technical outlook suggests a further rally, with bulls targeting levels above $0.0065.

Zilliqa (ZIL) price trades above $0.0058 on Wednesday, up more than 13% over the last two days. Bullish sentiment strengthens as trading volume and Open Interest (OI) rise, alongside positive funding rates. On the technical side, indicators suggest a rally continuation, targeting the $0.0065 mark.
Zilliqa on-chain and derivatives data suggest bullish bias
Santiment data indicate that the ZIL ecosystem’s trading volume (the aggregate trading volume generated by all exchange applications on the chain) reached $92.59 million on Monday, the highest level since July 4, and steadied at around $27.46 million on Wednesday. This volume rise indicates a surge in traders’ interest and liquidity in Zilliqa, boosting its bullish outlook.
 [09-1768366899873-1768366899874.33.40, 14 Jan, 2026].png)
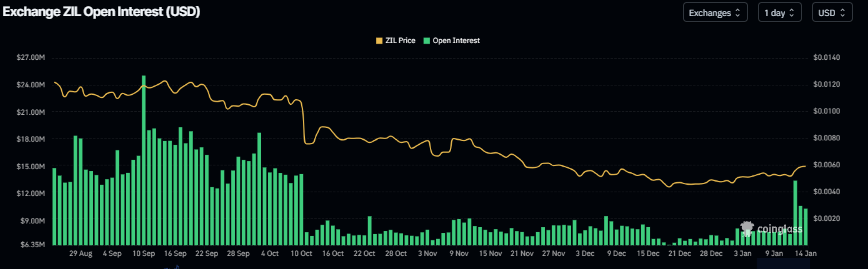
Derivatives data further support the positive view for ZIL. CoinGlass’s data show that ZIL futures OI across exchanges reached $13.48 million on Tuesday, the highest level since October 11. An increasing OI represents new or additional money entering the market and new buying, which could fuel the current ZIL price rally.
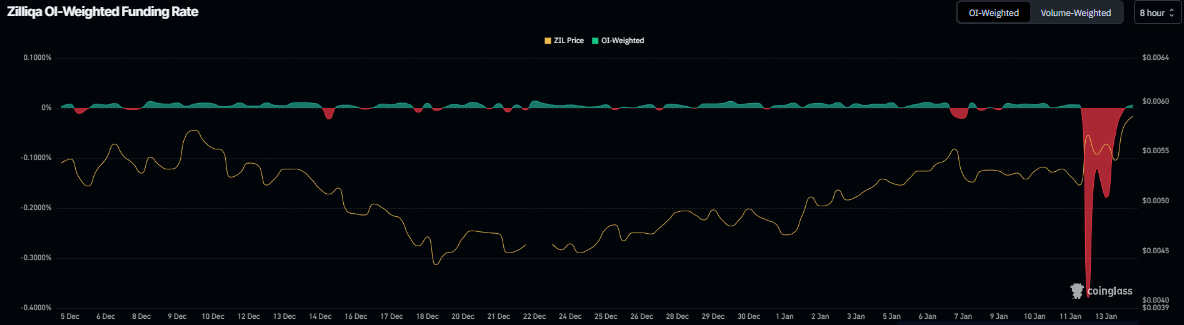
Coinglass’s OI-Weighted Funding Rate data shows that the number of traders betting that the price of ZIL will slide further is lower than those anticipating a price increase.
The metric has flipped to a positive rate, standing at 0.0059% on Wednesday, indicating that longs are paying shorts. Historically, as shown in the chart below, when the funding rates have flipped from negative to positive, Zilliqa’s price has rallied sharply.
Zilliqa Price Forecast: ZIL bulls aiming for the $0.0065 mark
Zilliqa price surged more than 9% on Monday and closed above the 50-day Exponential Moving Average (EMA) at $0.0055. ZIL continued its rally the next day, finding support around the 50-day EMA and closing above the daily resistance at $0.0058. As of Wednesday, ZIL is trading at around $0.0058.
If ZIL continues its upward trend, it could extend the rally toward the next resistance at $0.0065, its 100-day EMA.
The Relative Strength Index (RSI) on the daily chart is 65, above the neutral level of 50, indicating bullish momentum is gaining traction. Moreover, the Moving Average Convergence Divergence (MACD) shows a bullish crossover that remains intact, with rising green histogram bars above the neutral level, further supporting the positive outlook.
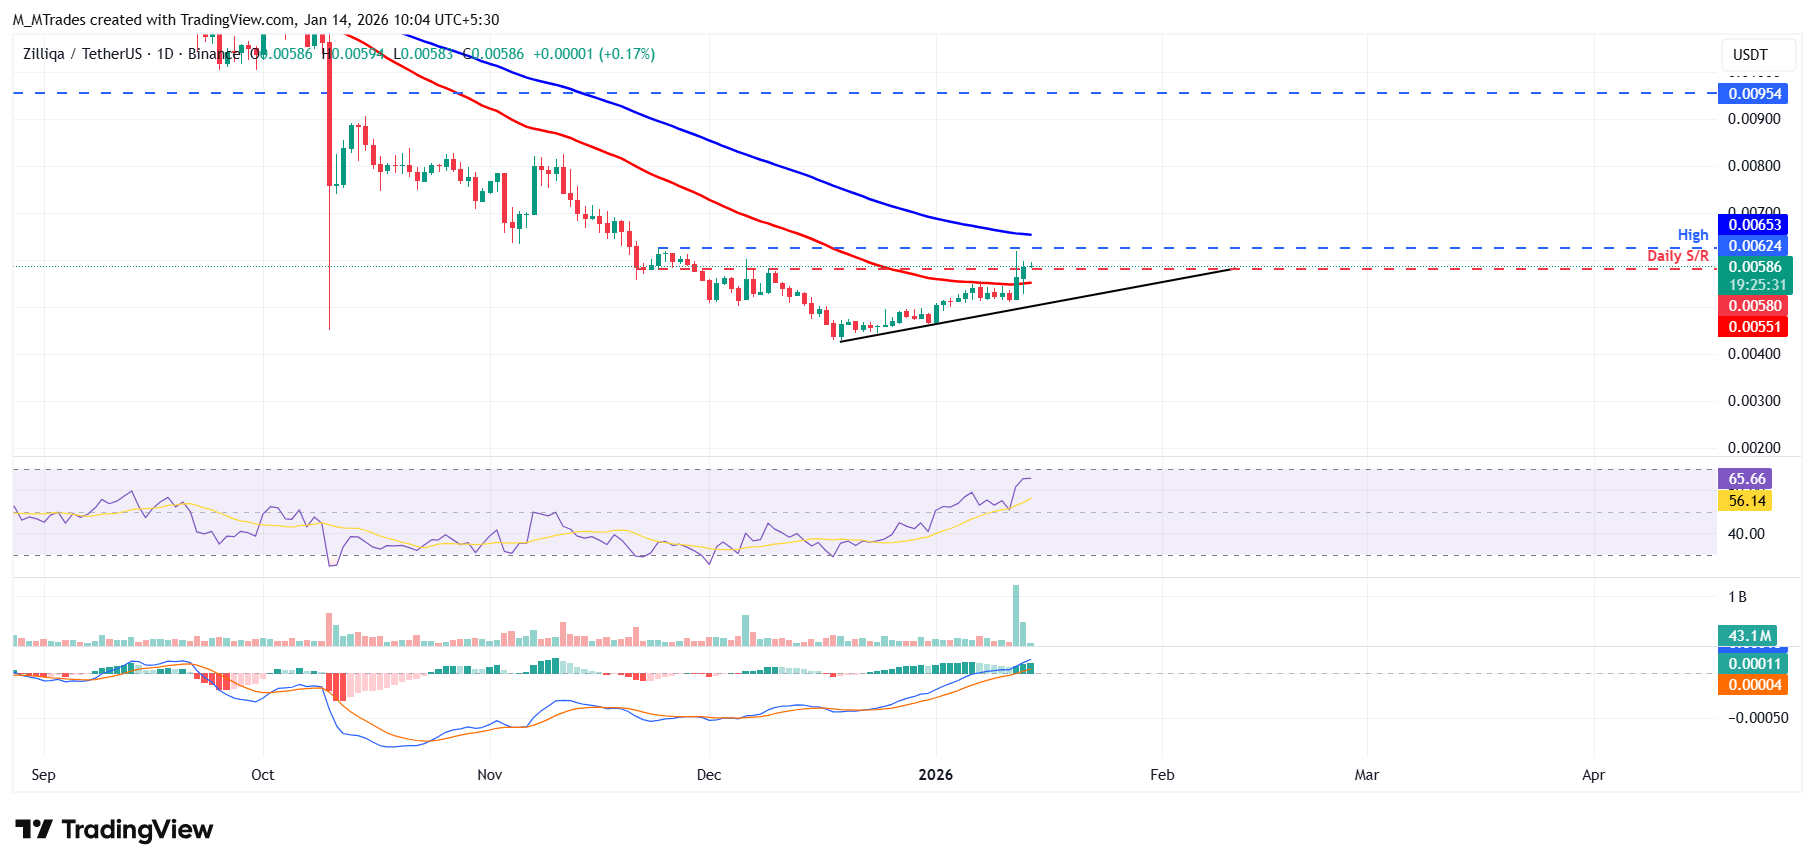
However, if ZIL faces a correction, it could extend the decline toward the 50-day EMA at $0.0055.
Author

Manish Chhetri
FXStreet
Manish Chhetri is a crypto specialist with over four years of experience in the cryptocurrency industry.


