Kite Price Forecast: KITE surges 14%, outpacing other AI crypto tokens
- Kite rallies over 14% and holds above $0.27 despite wider crypto market doldrums.
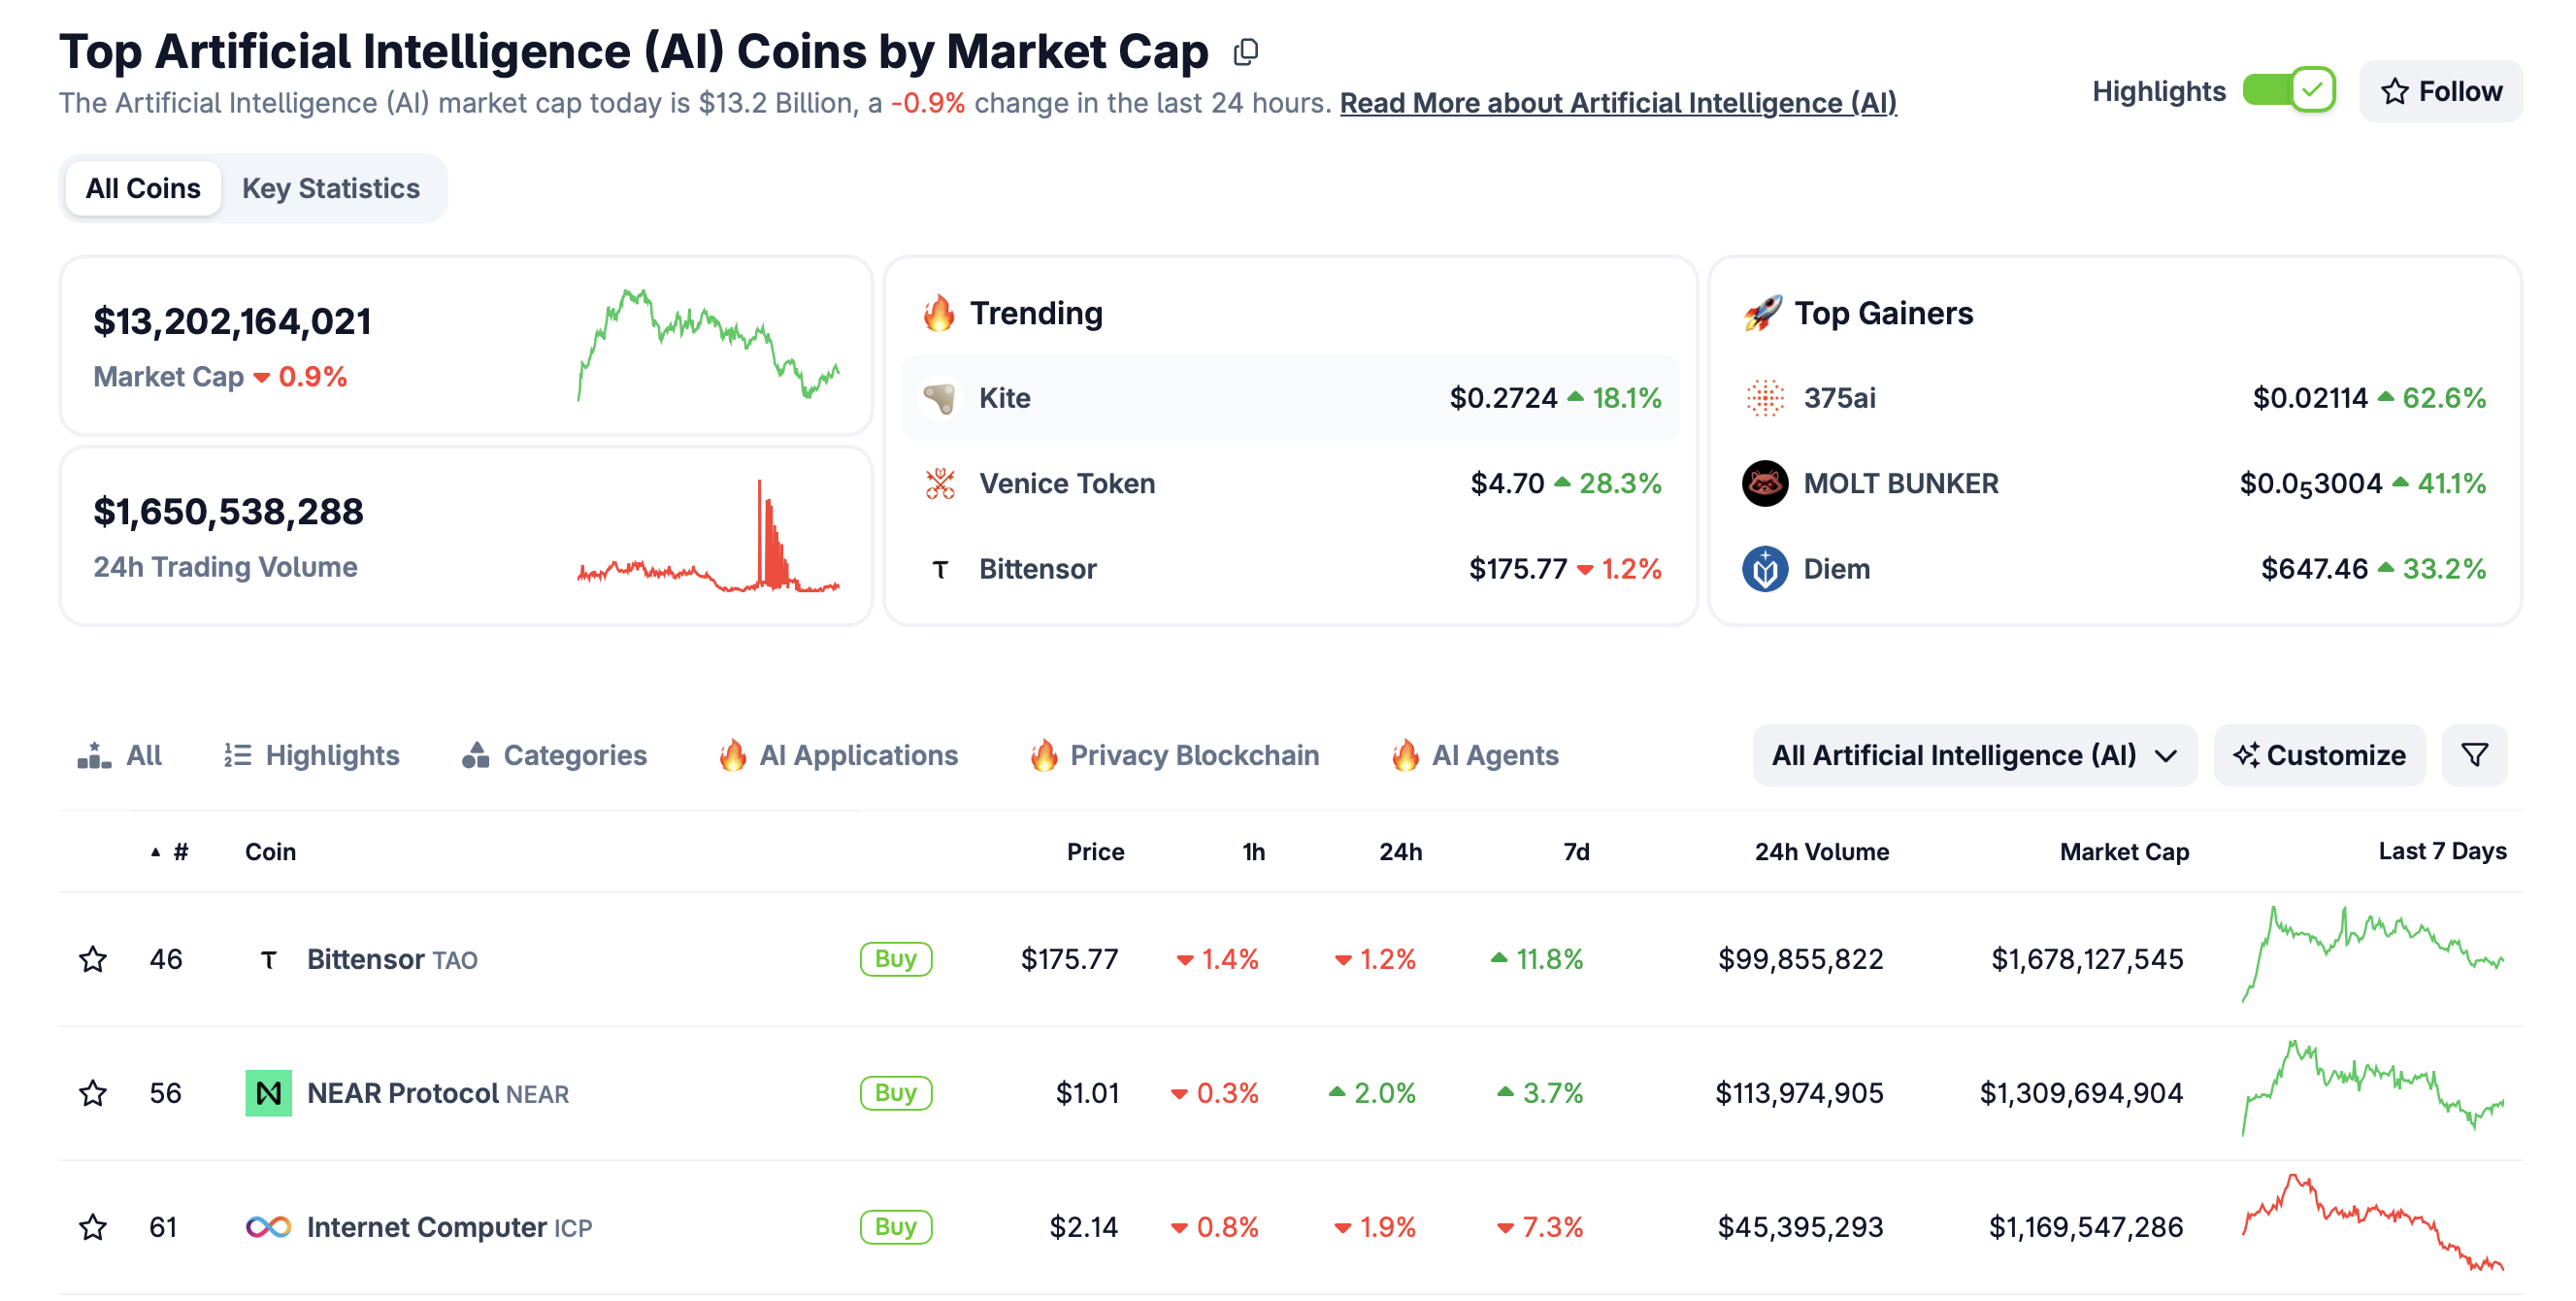
- The AI segment’s market capitalization slips to $13.2 billion as leading tokens such as Bittensor struggle.
- A robust technical structure characterised by a MACD buy signal a trailing Super Trend support Kite’s bullish outlook.

Kite (KITE) is extending its rally above $0.27 at the time of writing on Friday, supported by positive market sentiment within its ecosystem. The Artificial Intelligence (AI) crypto token is up over 14% intraday and 18% over the past 24 hours, highlighting its overall uptrend.
AI crypto market decline as Kite rallies
Leading tokens in the crypto AI segment, including Bittensor (TAO), Near Protocol (NEAR) and Internet Computer (ICP), are trading amid persistent headwinds in the broader cryptocurrency market.
Bittensor hovers at $174, down 2% over the past 24 hours. Near Protocol holds steady at $1.00, up 1.5% over the past 24 hours, while Internet Computer (ICP) is down 2% in the same period and trading at $2.13. The AI crypto market capitalization edges lower to $13.2 billion, underscoring a sticky risk-off sentiment.
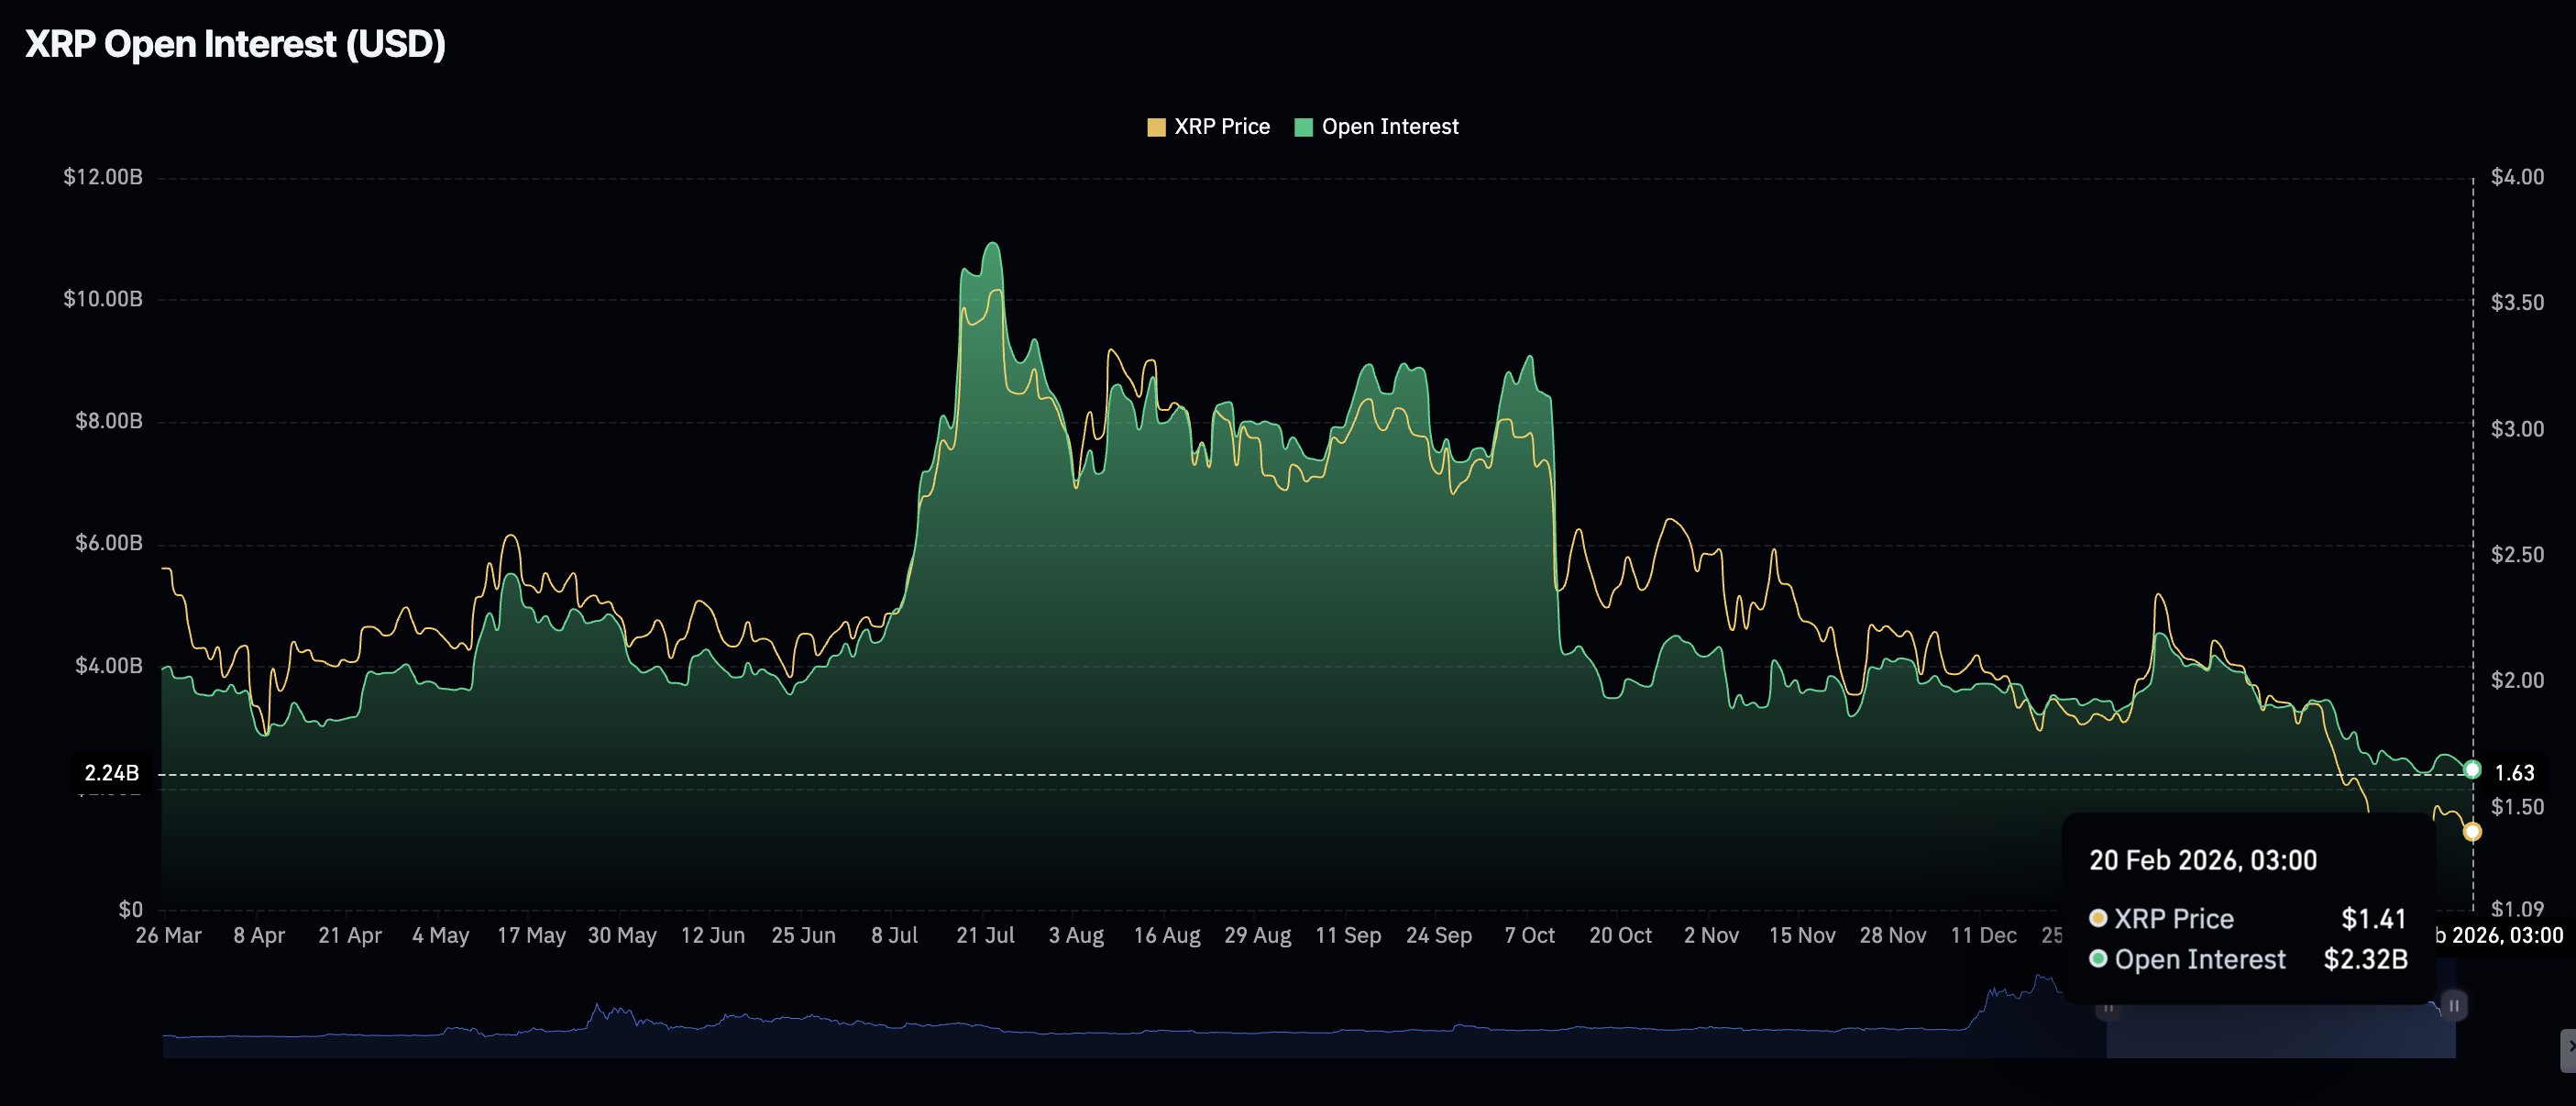
Meanwhile, renewed retail interest has pushed Kite’s futures Open Interest (OI) to $98 million on Friday, from $96 million the previous day. A further increase in demand would stabilize prices at higher levels and encourage traders to lean into risk.
Technical outlook: Kite bulls tighten their grip
Kite hovers above $0.27, sitting well above the 50 Exponential Moving Average (EMA) at $0.22, the 100 EMA at $0.20 and the 200 EMA at $0.17 on the 4-hour chart. All three moving averages are sloping upward, preserving the overall bullish bias, besides holding in line to absorb potential selling pressure.
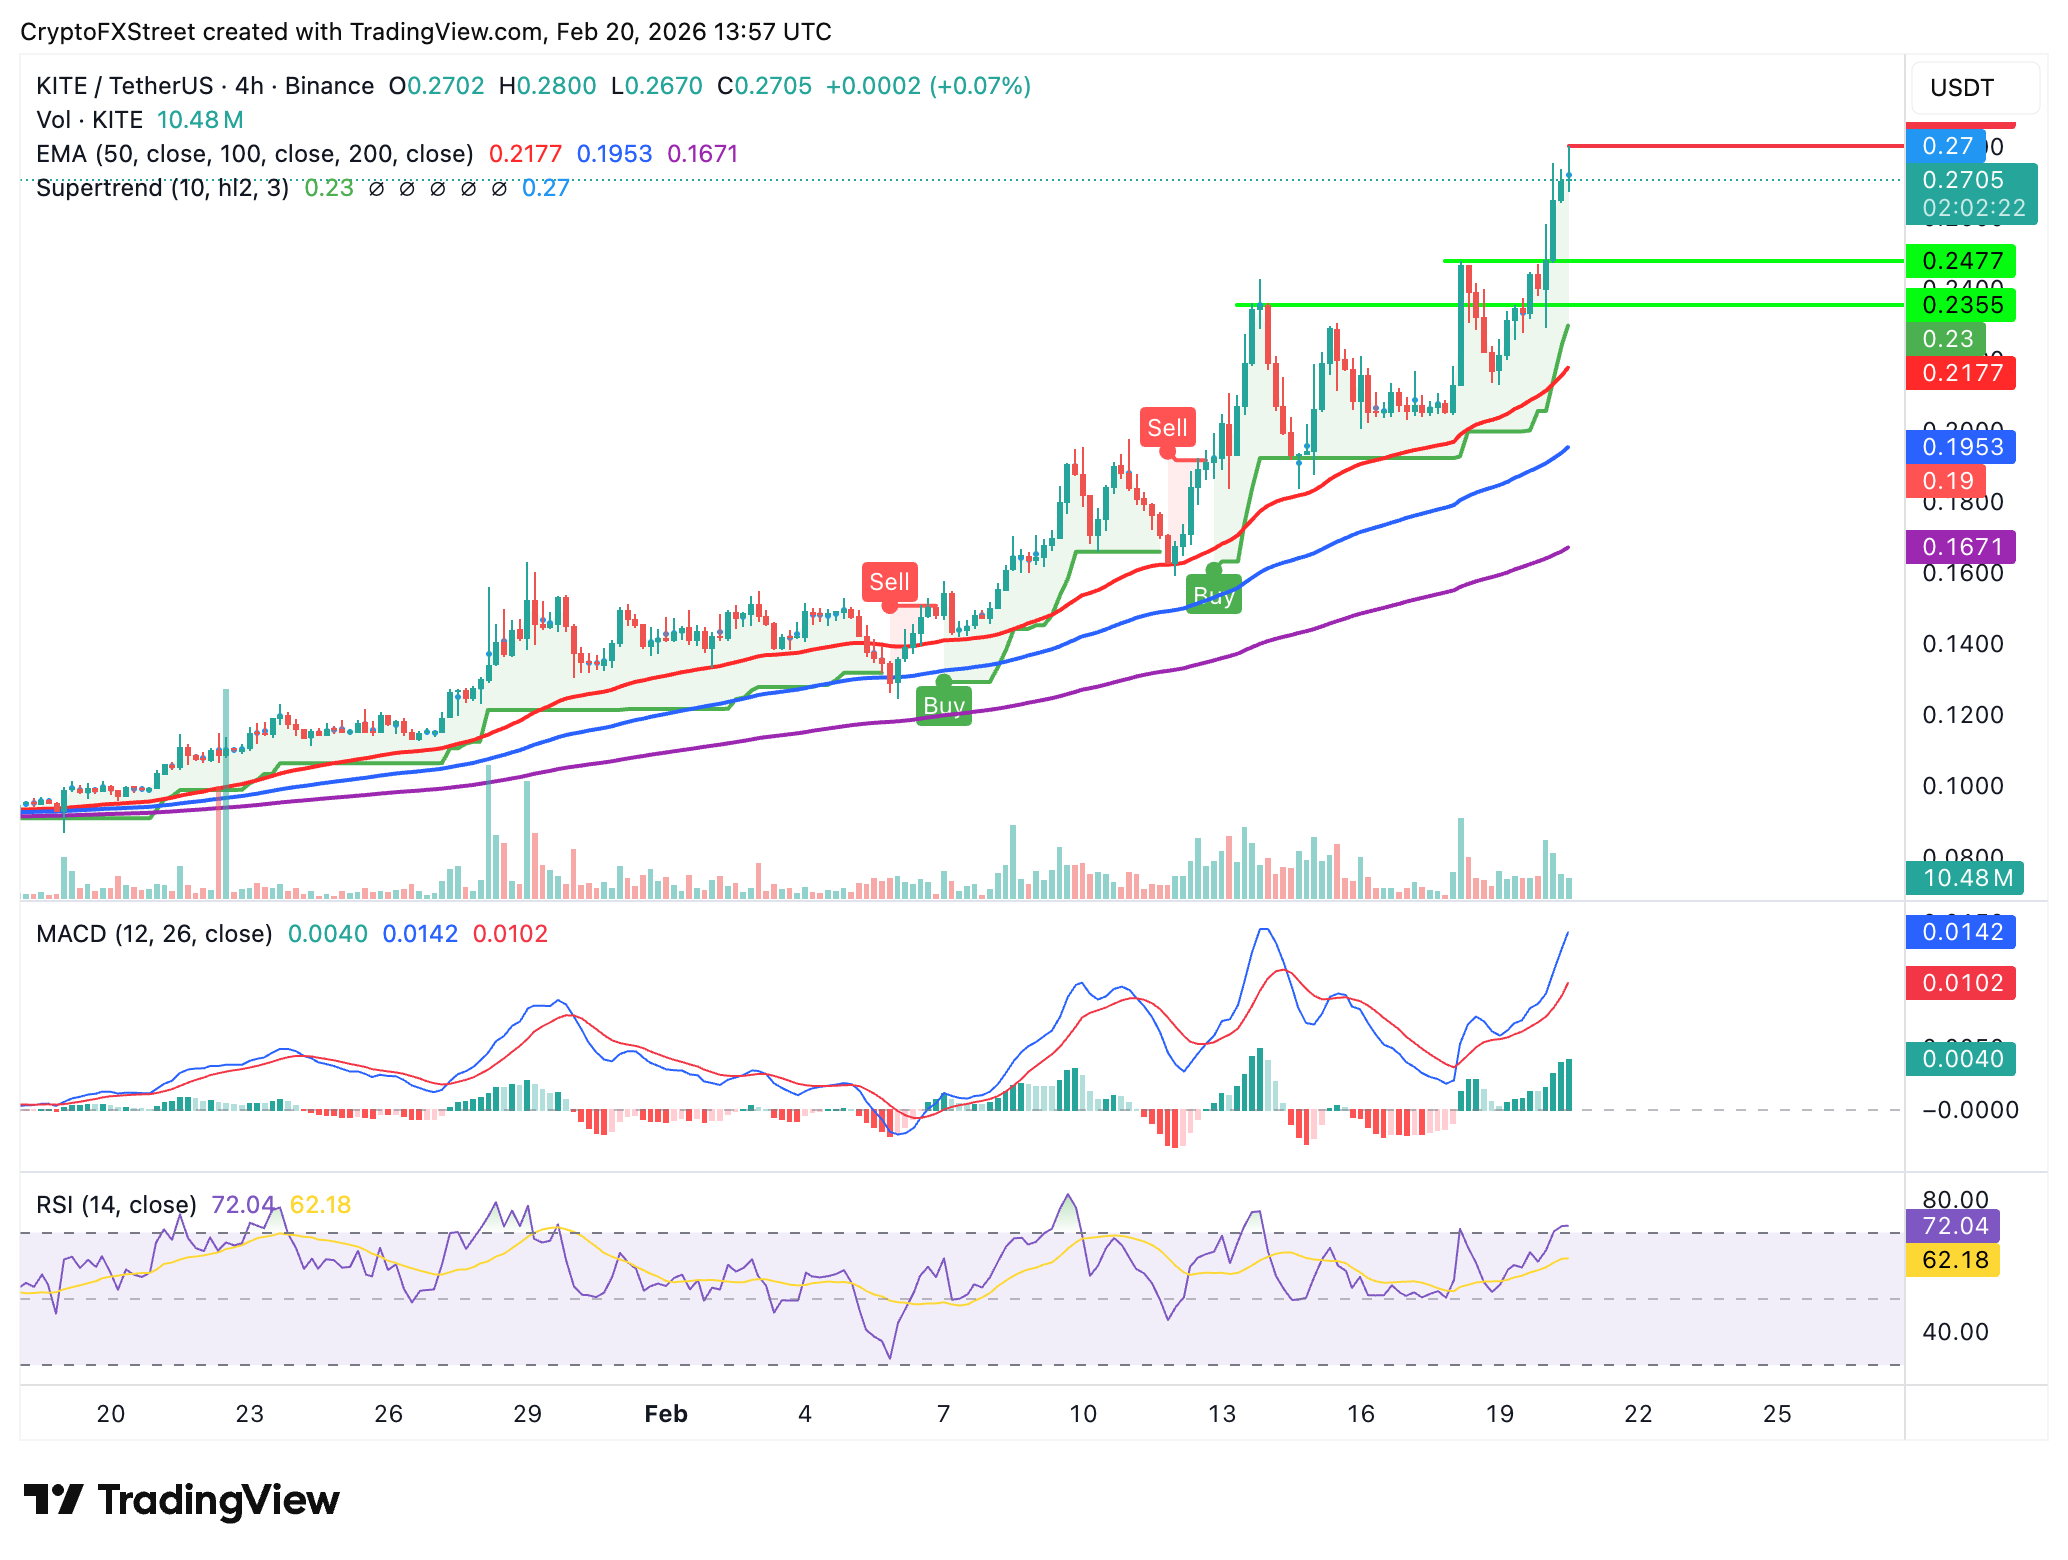
The Moving Average Convergence Divergence (MACD) indicator remains above its signal line, while the green histogram bars expand, increasing the odds of an extended uptrend as bullish momentum builds.
At the same time, the Relative Strength Index (RSI) at 72 on the daily chart also rises in tandem with Kite. However, traders should be cautious as an extremely overbought RSI often precedes a price correction.
Open Interest, funding rate FAQs
Higher Open Interest is associated with higher liquidity and new capital inflow to the market. This is considered the equivalent of increase in efficiency and the ongoing trend continues. When Open Interest decreases, it is considered a sign of liquidation in the market, investors are leaving and the overall demand for an asset is on a decline, fueling a bearish sentiment among investors.
Funding fees bridge the difference between spot prices and prices of futures contracts of an asset by increasing liquidation risks faced by traders. A consistently high and positive funding rate implies there is a bullish sentiment among market participants and there is an expectation of a price hike. A consistently negative funding rate for an asset implies a bearish sentiment, indicating that traders expect the cryptocurrency’s price to fall and a bearish trend reversal is likely to occur.
Author

John Isige
FXStreet
John Isige is a seasoned cryptocurrency journalist and markets analyst committed to delivering high-quality, actionable insights tailored to traders, investors, and crypto enthusiasts. He enjoys deep dives into emerging Web3 tren