Crypto Today: Bitcoin, Ethereum, XRP rebound as risk appetite improves
- Bitcoin recovers near $68,000 as retail investors show subtle signs of returning to the market.
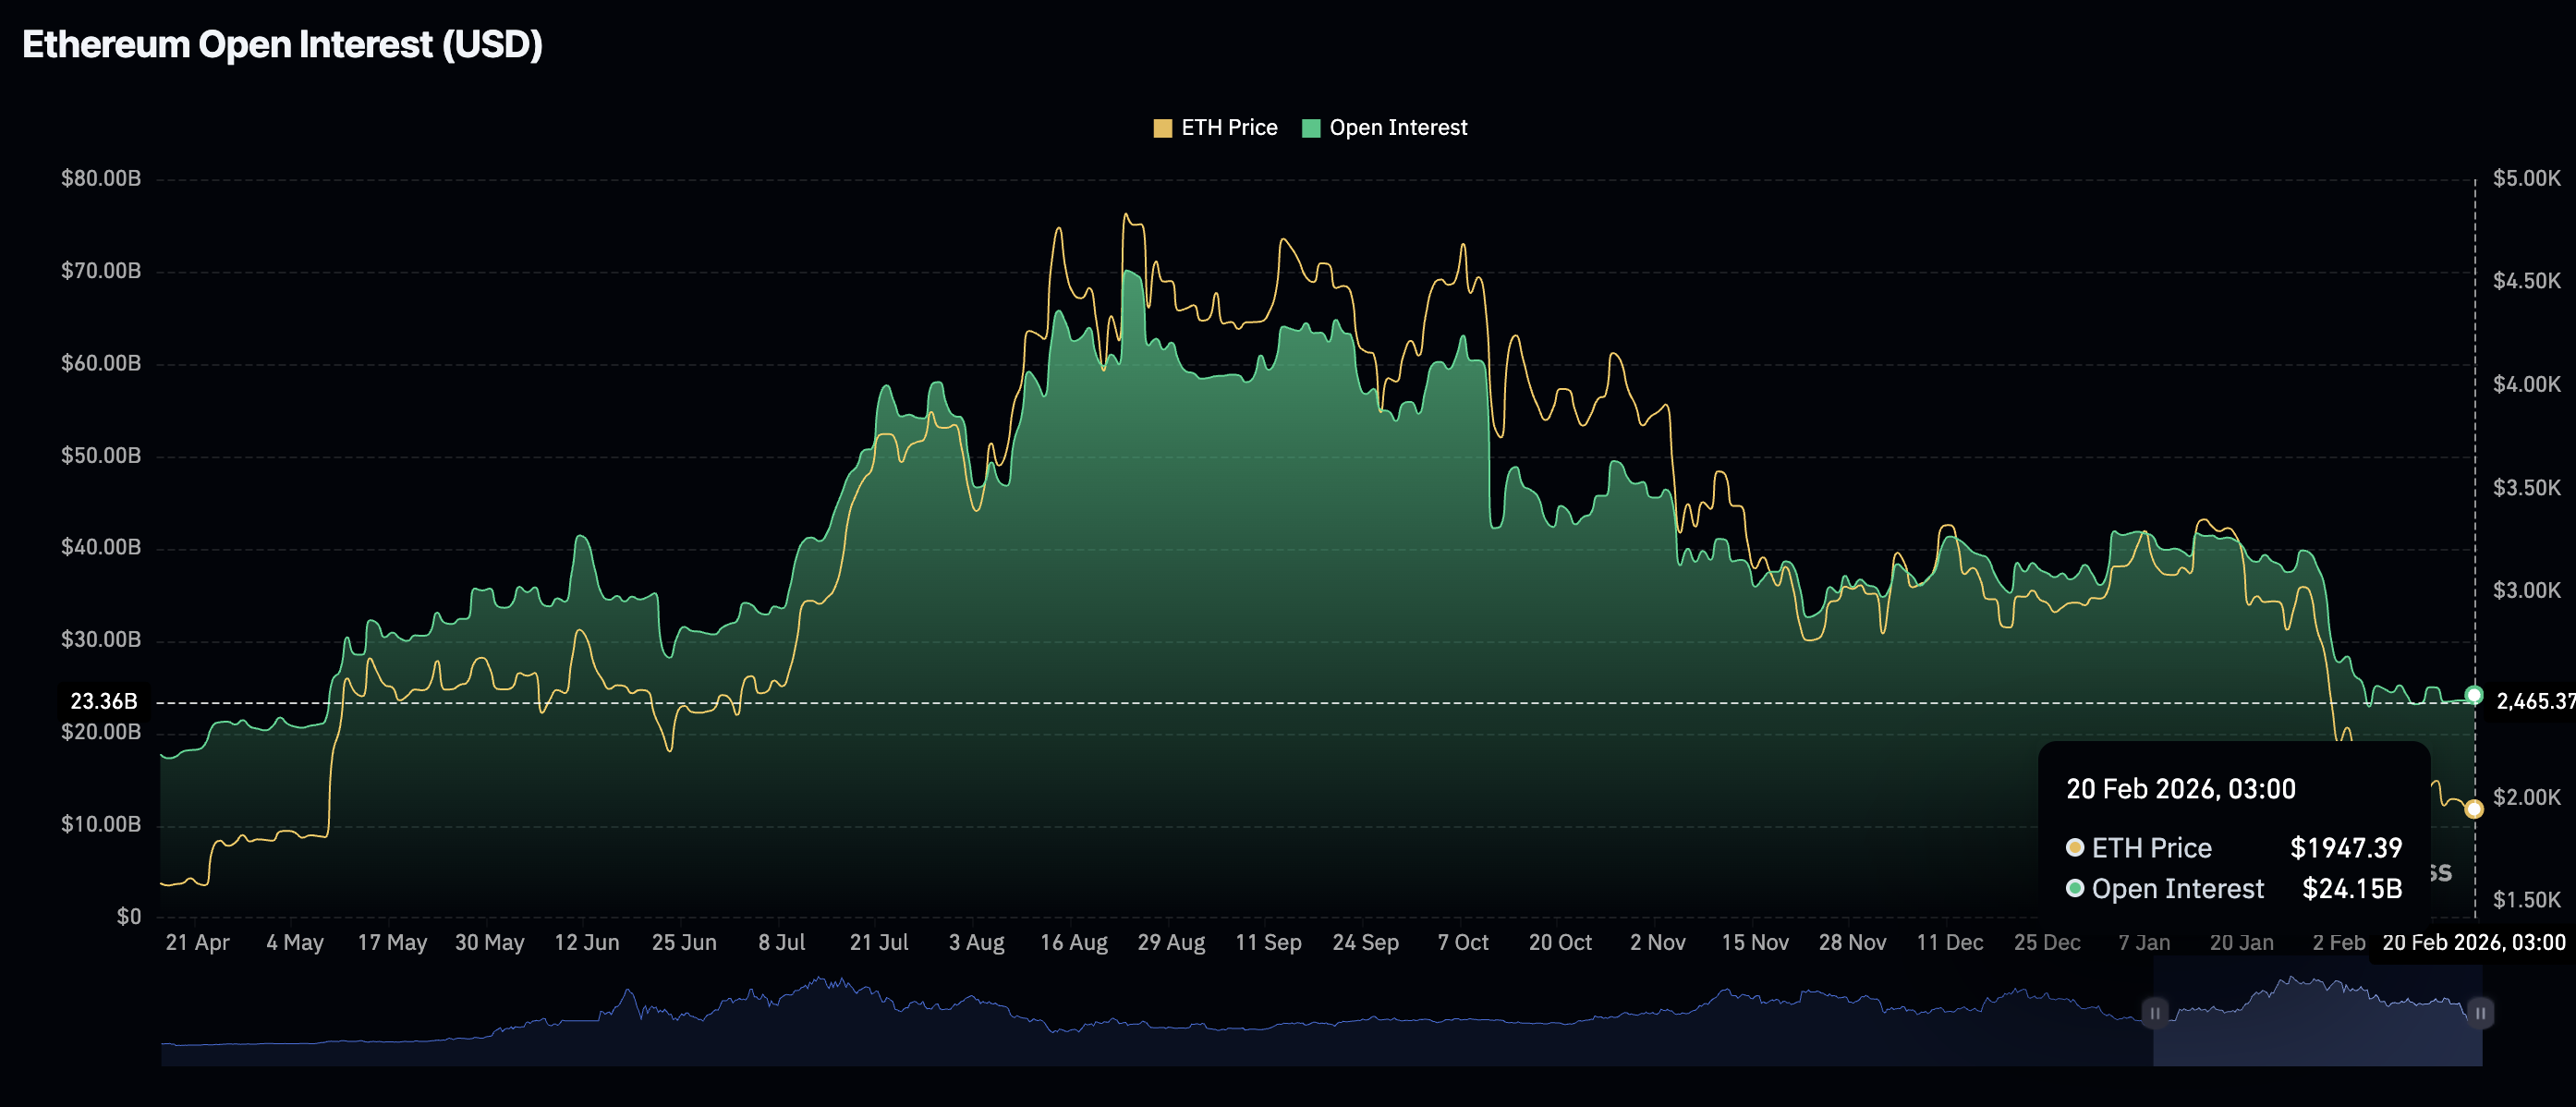
- Ethereum trades sideways in a range amid mixed technical signals and a slight increase in futures Open Interest to $24.15 billion.
- XRP holds $1.40, supported by the resurgence of ETF inflows.

Bitcoin (BTC) rises marginally, nearing the immediate resistance of $68,000 at the time of writing on Friday. Major altcoins, including Ethereum (ETH) and Ripple (XRP), hold key support levels as bulls aim to maintain marginal intraday gains.
Ethereum is supported by the lower end of the narrow range at $1,900, while the psychological threshold at $2,000 appears to limit its upside. The remittance token, XRP, sits slightly above support at $1.40.
Assessing Bitcoin, Ethereum and XRP’s recovery outlook
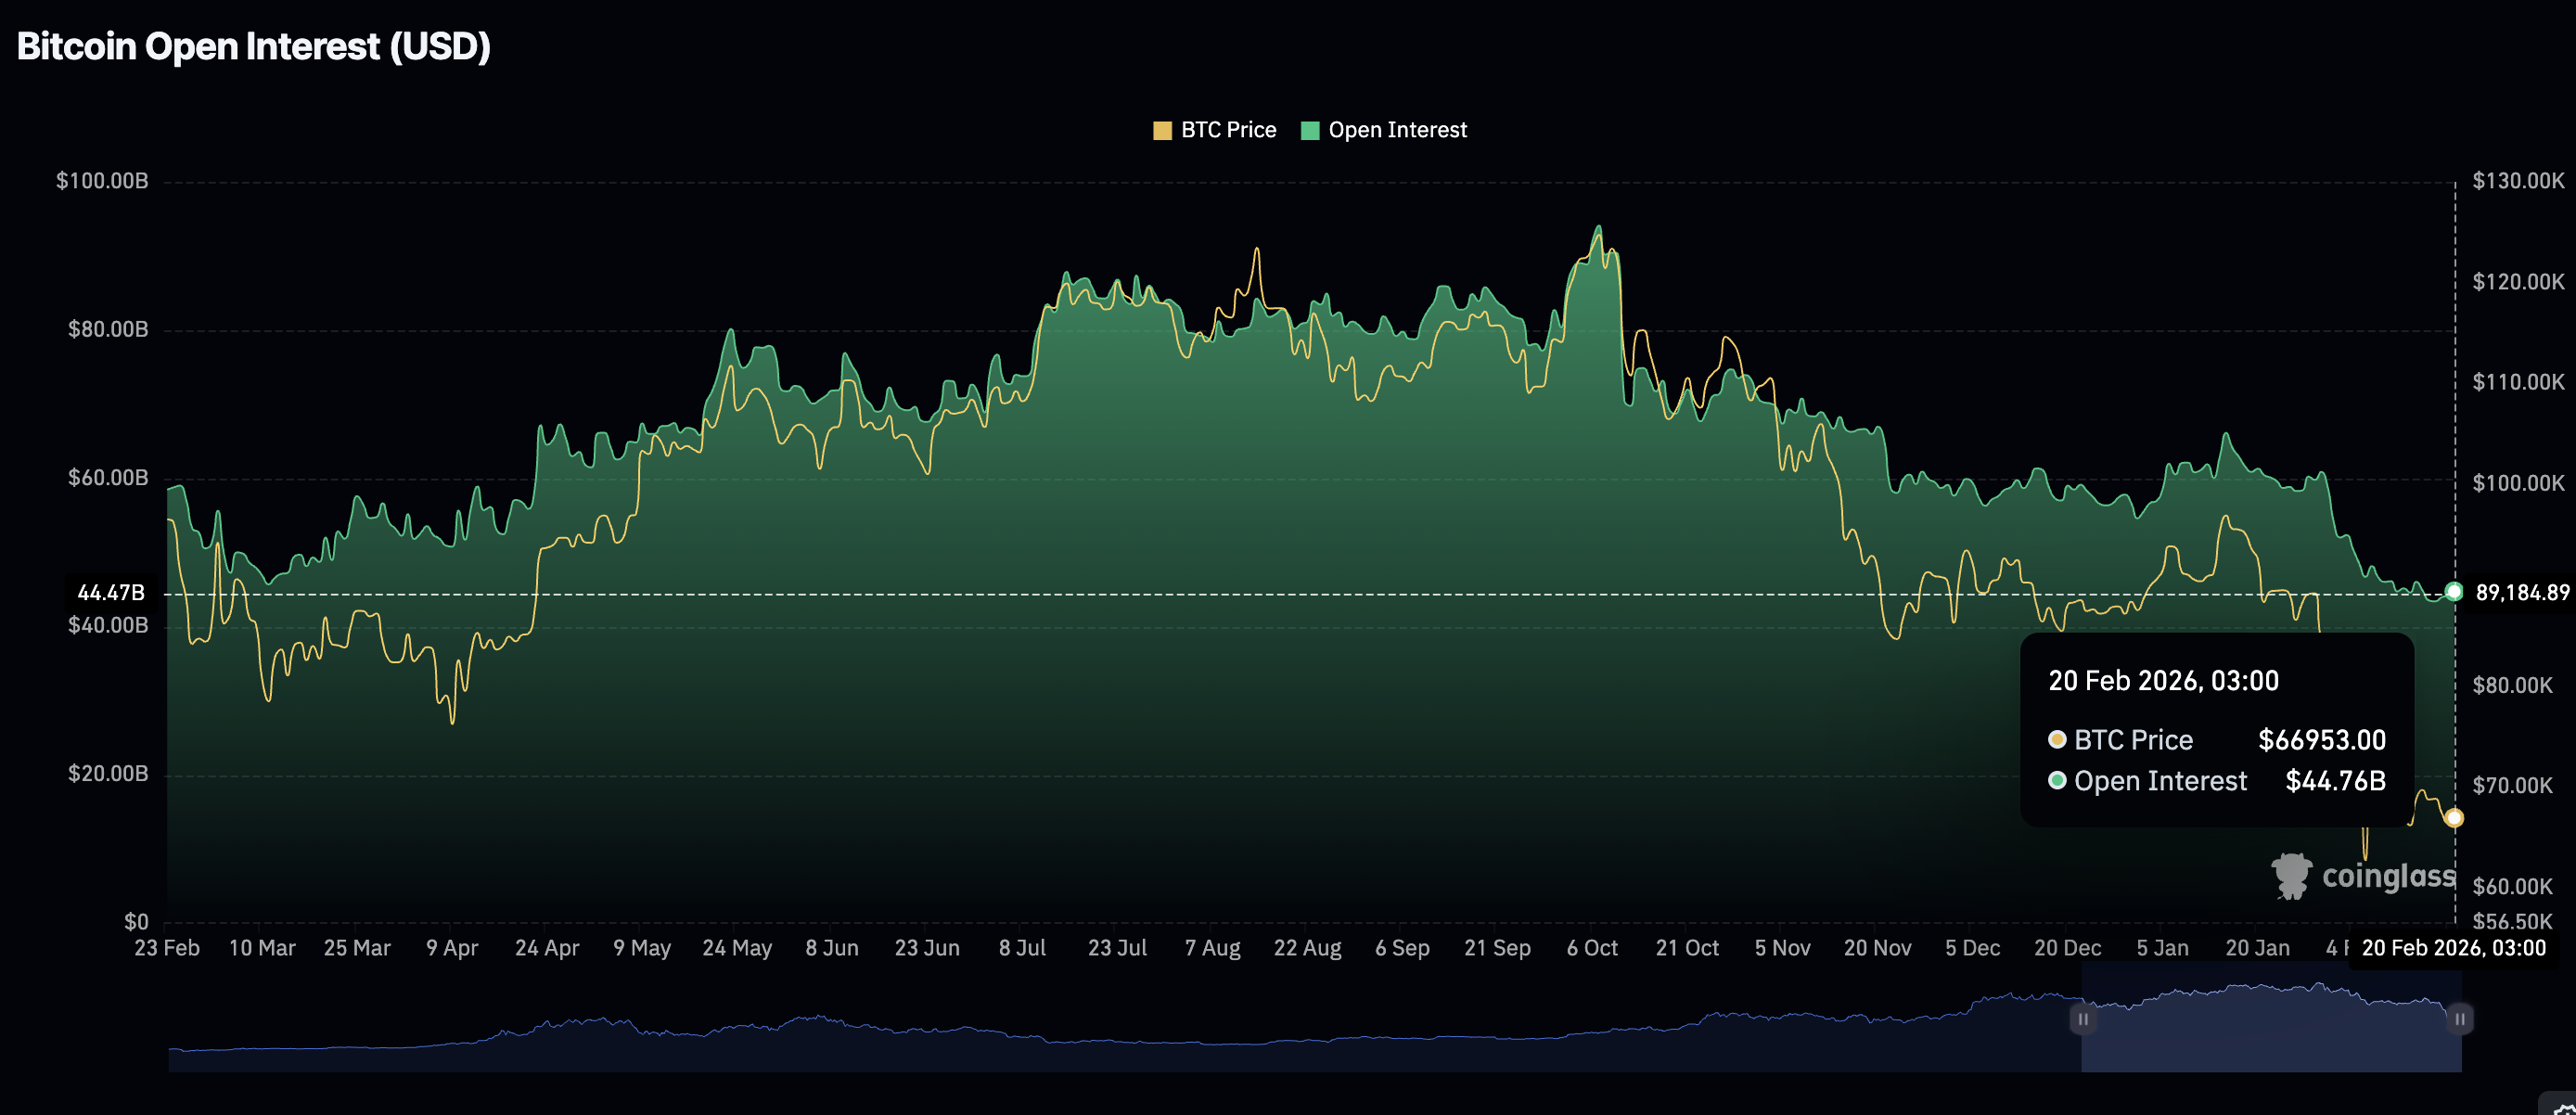
Bitcoin shows signs of extending its rebound above $68,000, supported by a strengthening derivatives market. After a persistent decline in futures Open Interest (OI) from a record $94.12 billion in October to $43.44 billion on Tuesday, OI rises to $44.76 billion on Friday.
Bitcoin requires steady growth in retail demand to sustain its recovery, as the lack of derivatives support leaves the Crypto King vulnerable to sell-side pressure, especially if macroeconomic uncertainty and geopolitical tensions persist.
Ethereum has also seen fading retail interest, as futures OI peaked at $70.13 billion in August, aligning with ETH’s all-time high of $4,956. CoinGlass data shows futures OI averaging $24.15 billion on Friday, up from $23.57 billion the previous day.
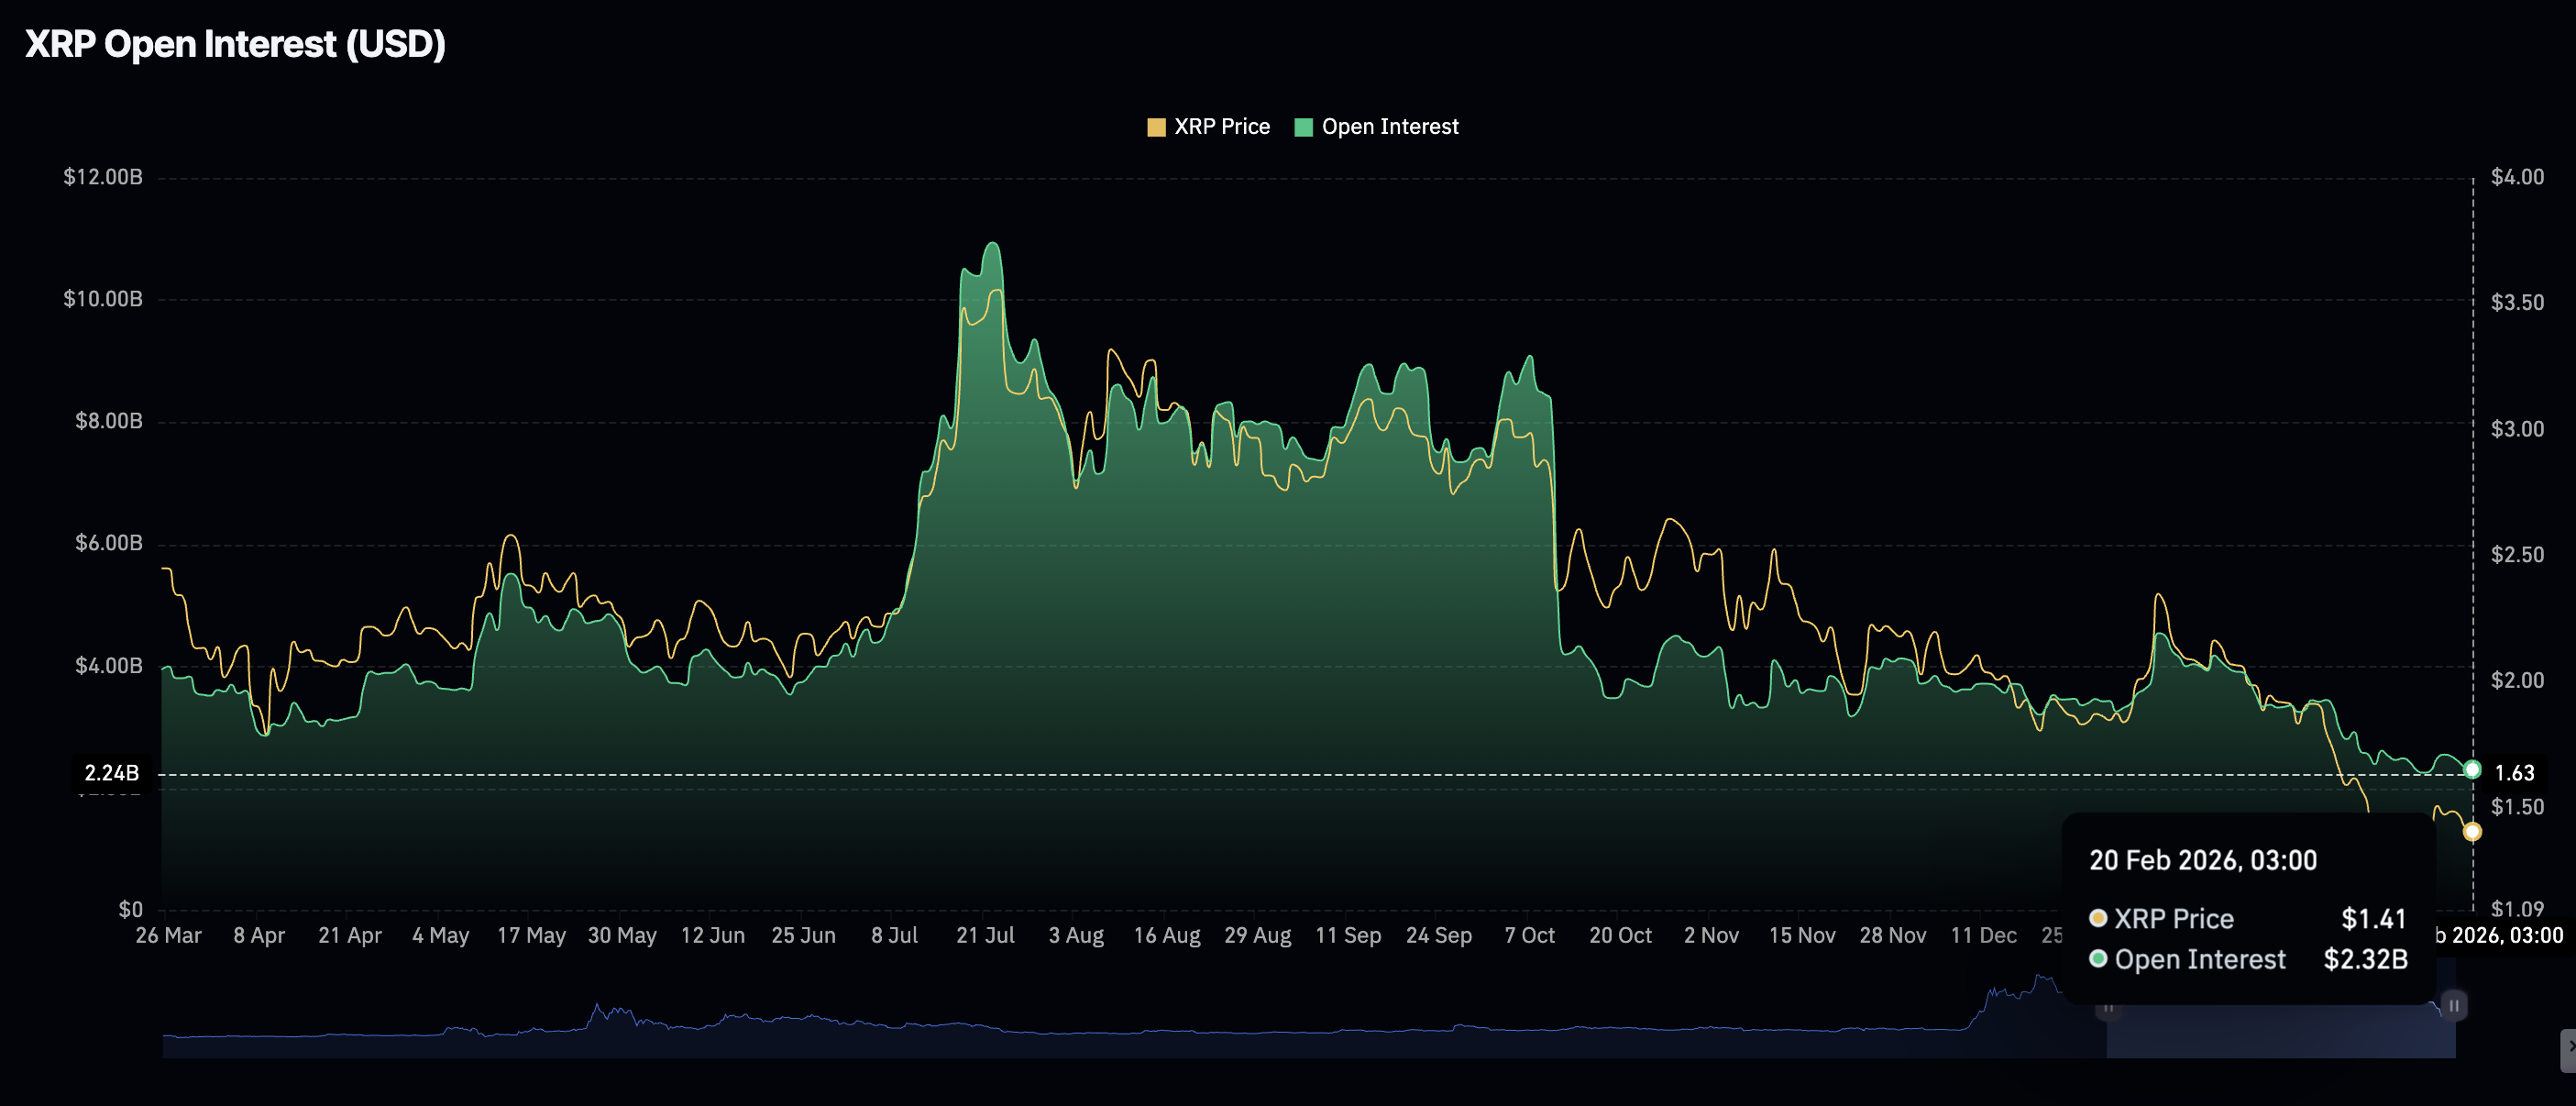
XRP, on the other hand, continues to face retail interest decay, as reflected by futures OI sliding to $2.32 billion on Friday from $2.45 billion the previous day. Like Ethereum and Bitcoin, XRP’s derivatives have significantly waned from the record high of $10.94 billion, reached in July, undermining recovery and retail interest. A further decline would considerably increase the odds of an extended sell-off.
Meanwhile, the XRP spot Exchange-Traded Funds (ETFs) paint a different picture, following the return of inflows on Thursday. US-listed XRP spot ETFs attracted approximately $4 million in deposits, bringing cumulative inflows to $1.23 billion and total assets under management to $1.01 billion.
If ETFs continue to receive attention, sentiment around XRP would improve, in turn increasing the chances of a recovery.
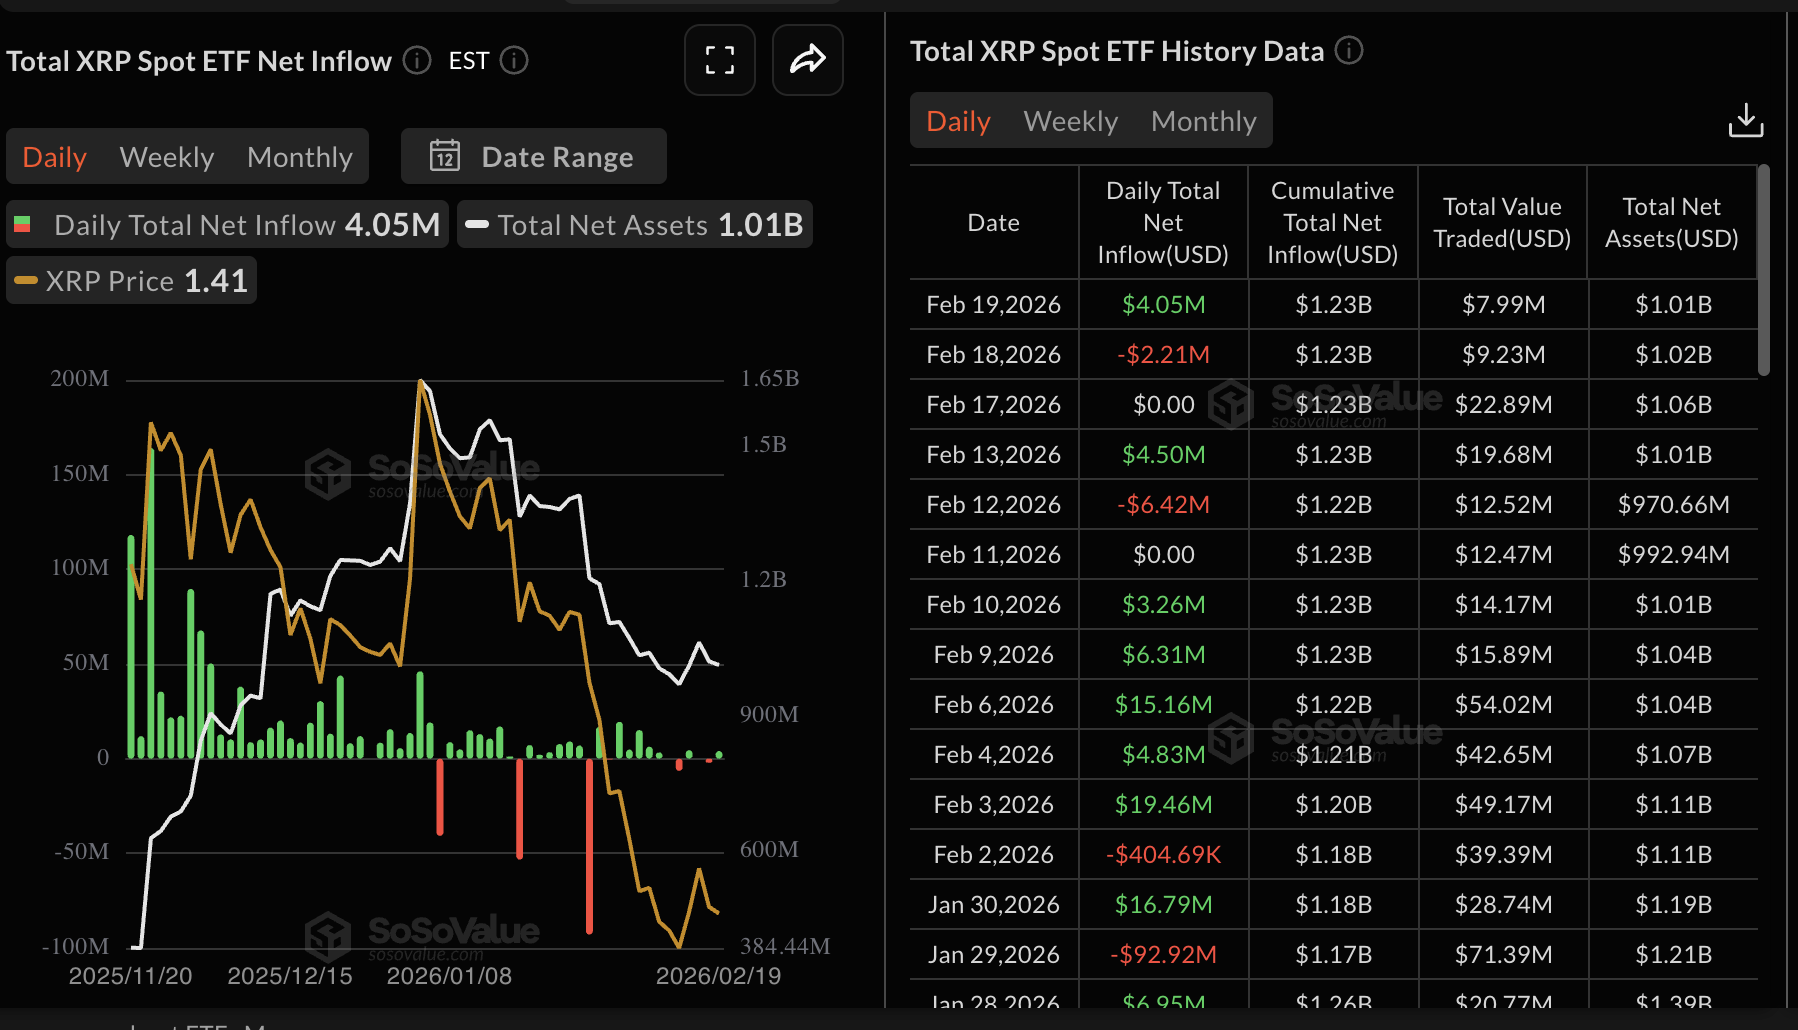
Chart of the day: Bitcoin bulls tighten their grip
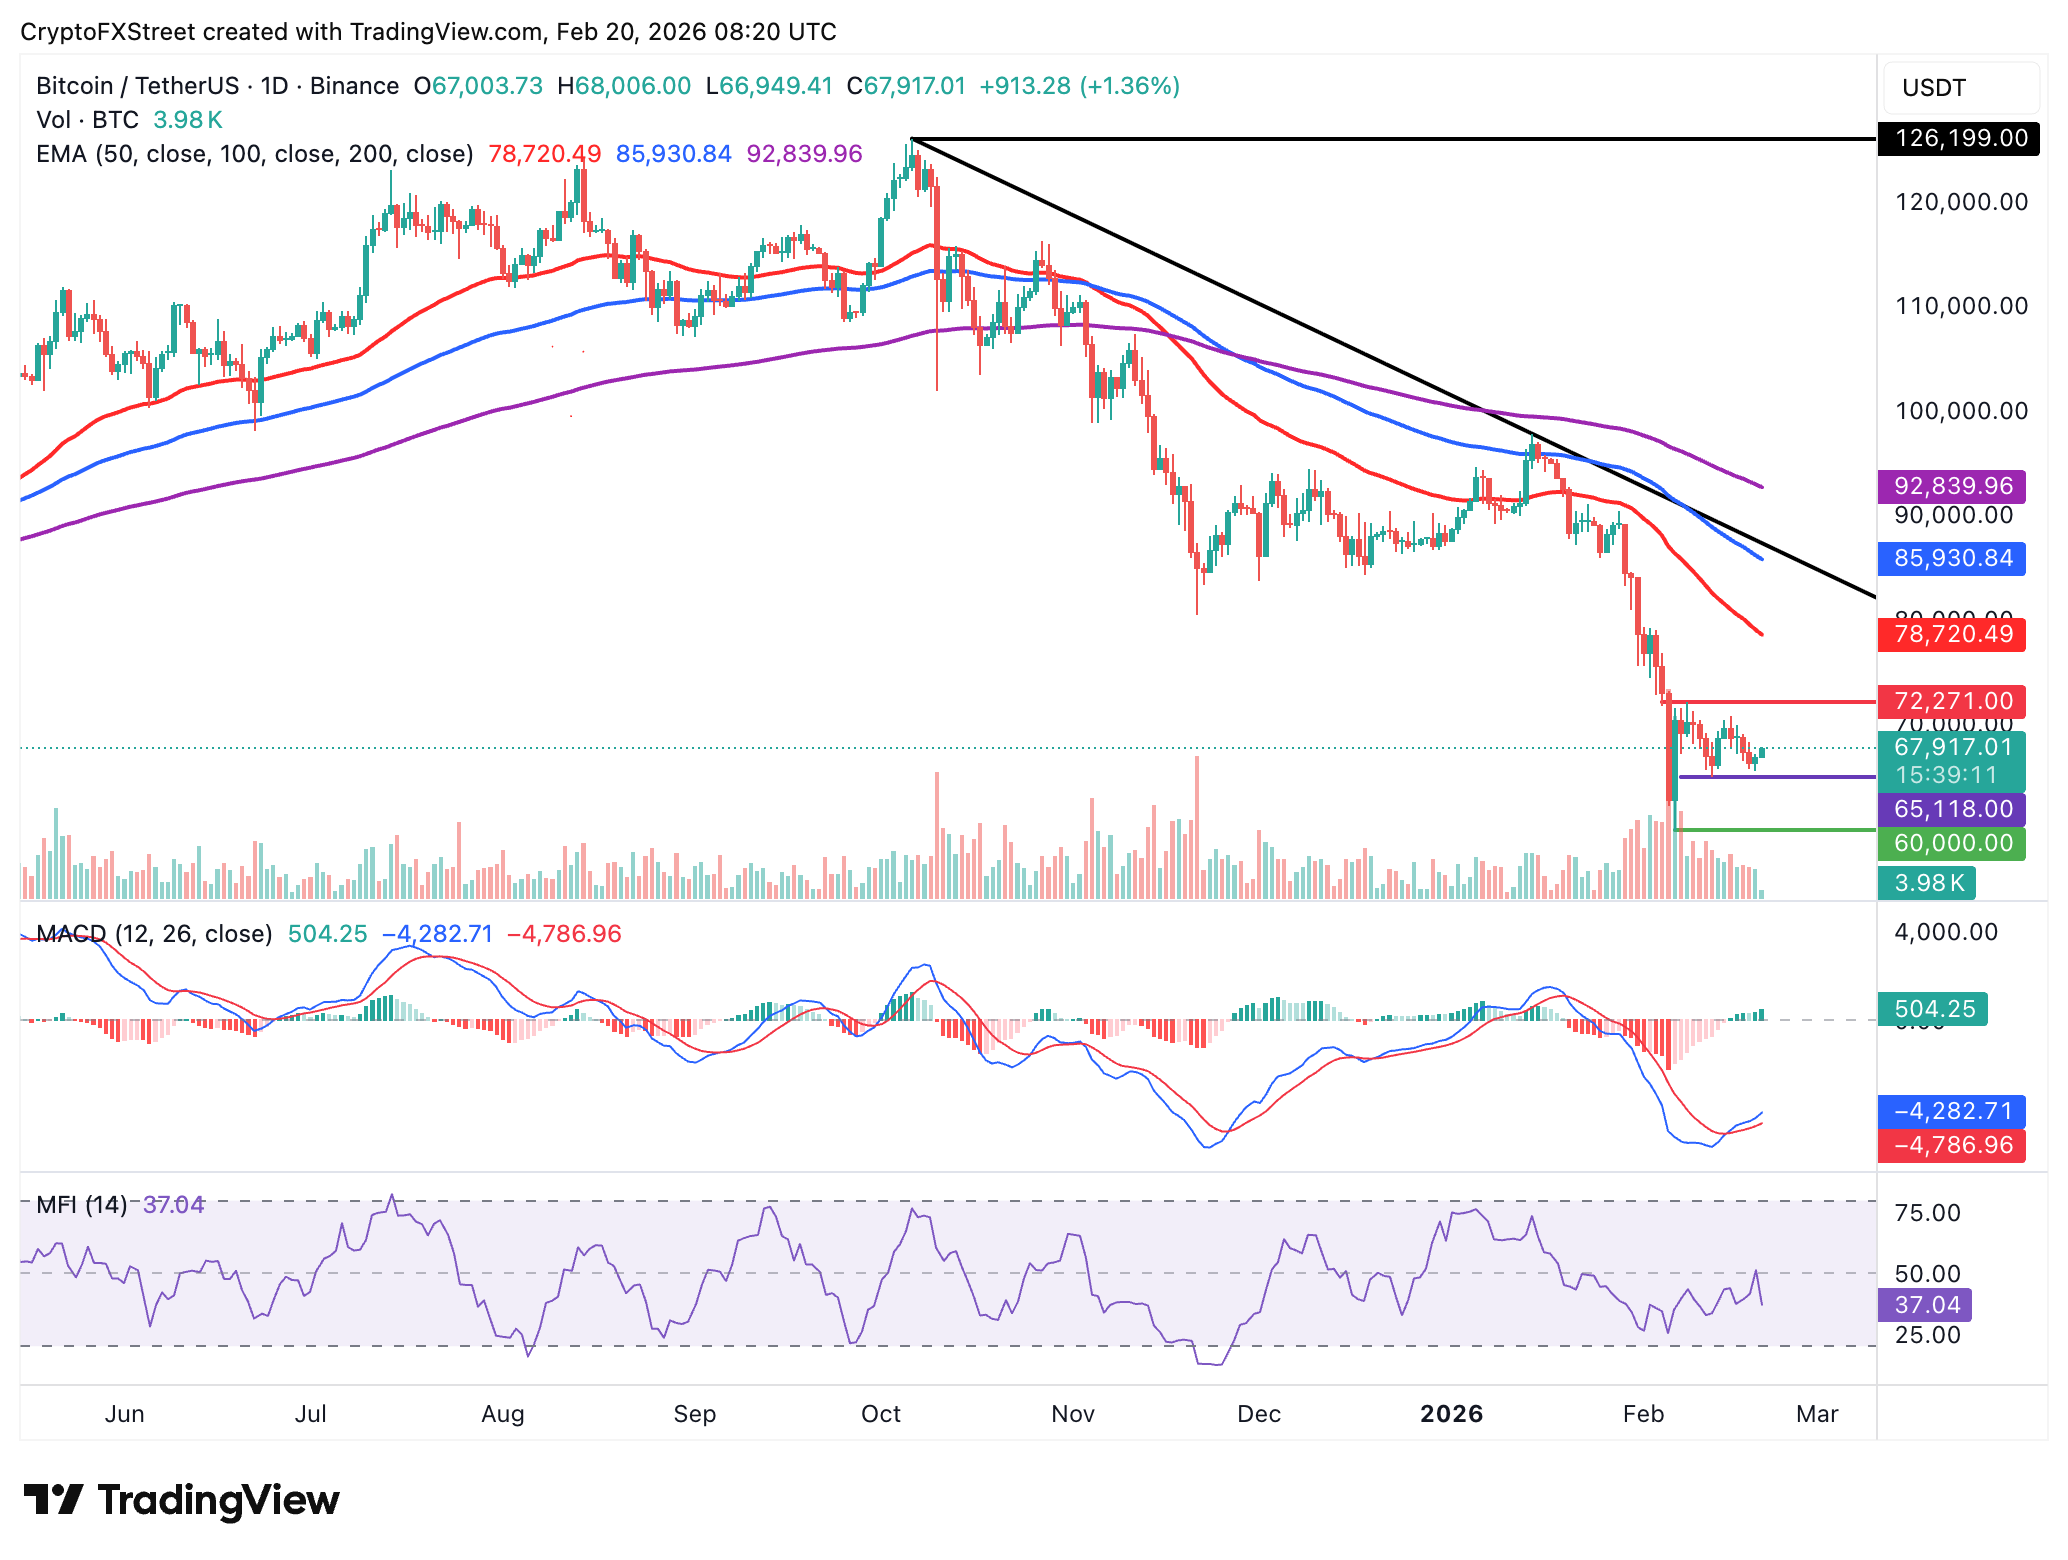
Bitcoin looks poised to break above the short-term $68,000 resistance, supported by the Moving Average Convergence Divergence (MACD) indicator, which remains above its signal line on the daily chart as green histogram bars expand.
A decisive break above $68,000 would reinforce BTC’s bullish thesis, making the leading crypto attractive to both retail and institutional investors. Key areas of interest include the psychological threshold at $70,000, which, if broken, would open the door to gains aiming for the February 8 high of $72,271.
Still, traders should temper their expectations, given that the 50-day Exponential Moving Average (EMA) at $78,720, the 100-day EMA at $85,931, and the 200-day EMA at $92,840 are all sloping downward, affirming an overall bearish trend.
Altcoins technical outlook: Ethereum, XRP extend recovery
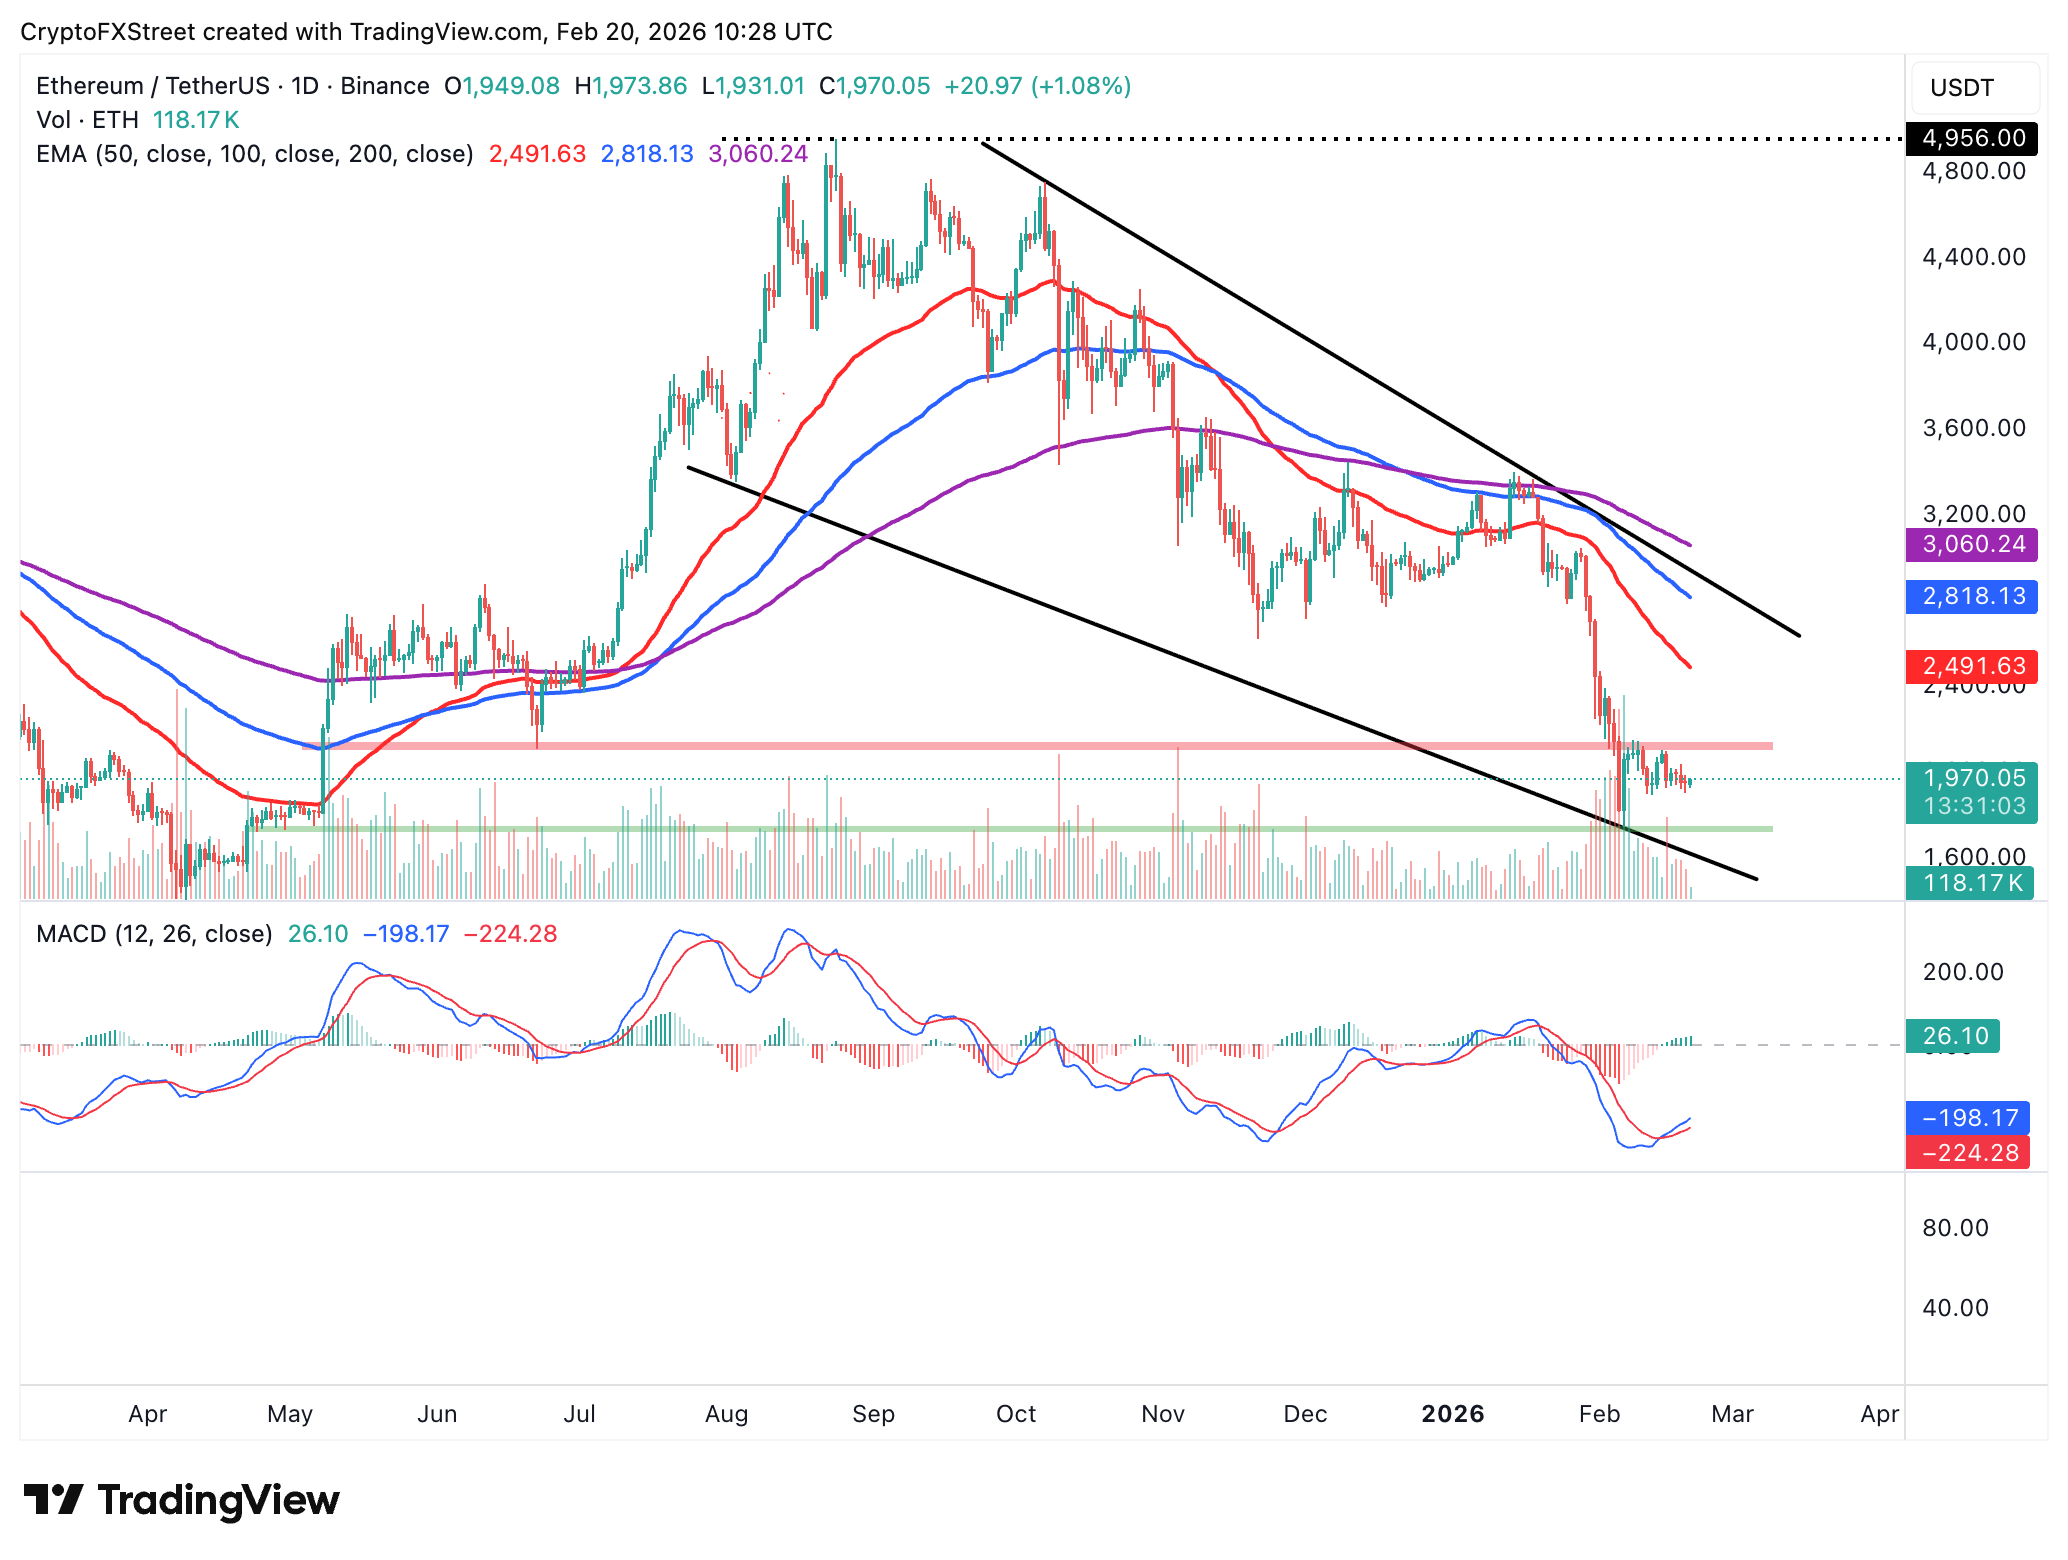
Ethereum is rising toward the psychological resistance at $2,000, as bullish momentum builds from an intraday low of $1,932. Despite the leading smart contracts token trading sideways in a range with support around $1,900 and resistance in the lower $2,000 range, the MACD indicator remains above its signal line on the daily chart, suggesting bullish momentum is building. The green histogram bars expand above the MACD’s zero line, prompting investors to increase exposure.
However, traders should pay attention to the downward-sloping 50-day EMA at $2,492, the 100-day EMA at $2,818 and the 200-day EMA at $3,060, which indicates that ETH’s trend is still largely bearish. A break above the 50-day EMA would reinforce the bullish grip.
XRP trades at $1.42, holding below the falling 50-day EMA at $1.69, the 100-day EMA at $1.90, and the 200-day EMA at $2.11, maintaining a broader bearish bias. This bearish moving-average stack continues to cap rebounds as the slopes remain downward.
Meanwhile, the MACD stands above its signal line on the daily chart, with modestly increasing histogram bars that hint at stabilizing momentum. At the same time, the Relative Strength Index (RSI) at 40 remains below 50 on the same chart, pointing to lingering downside pressure.
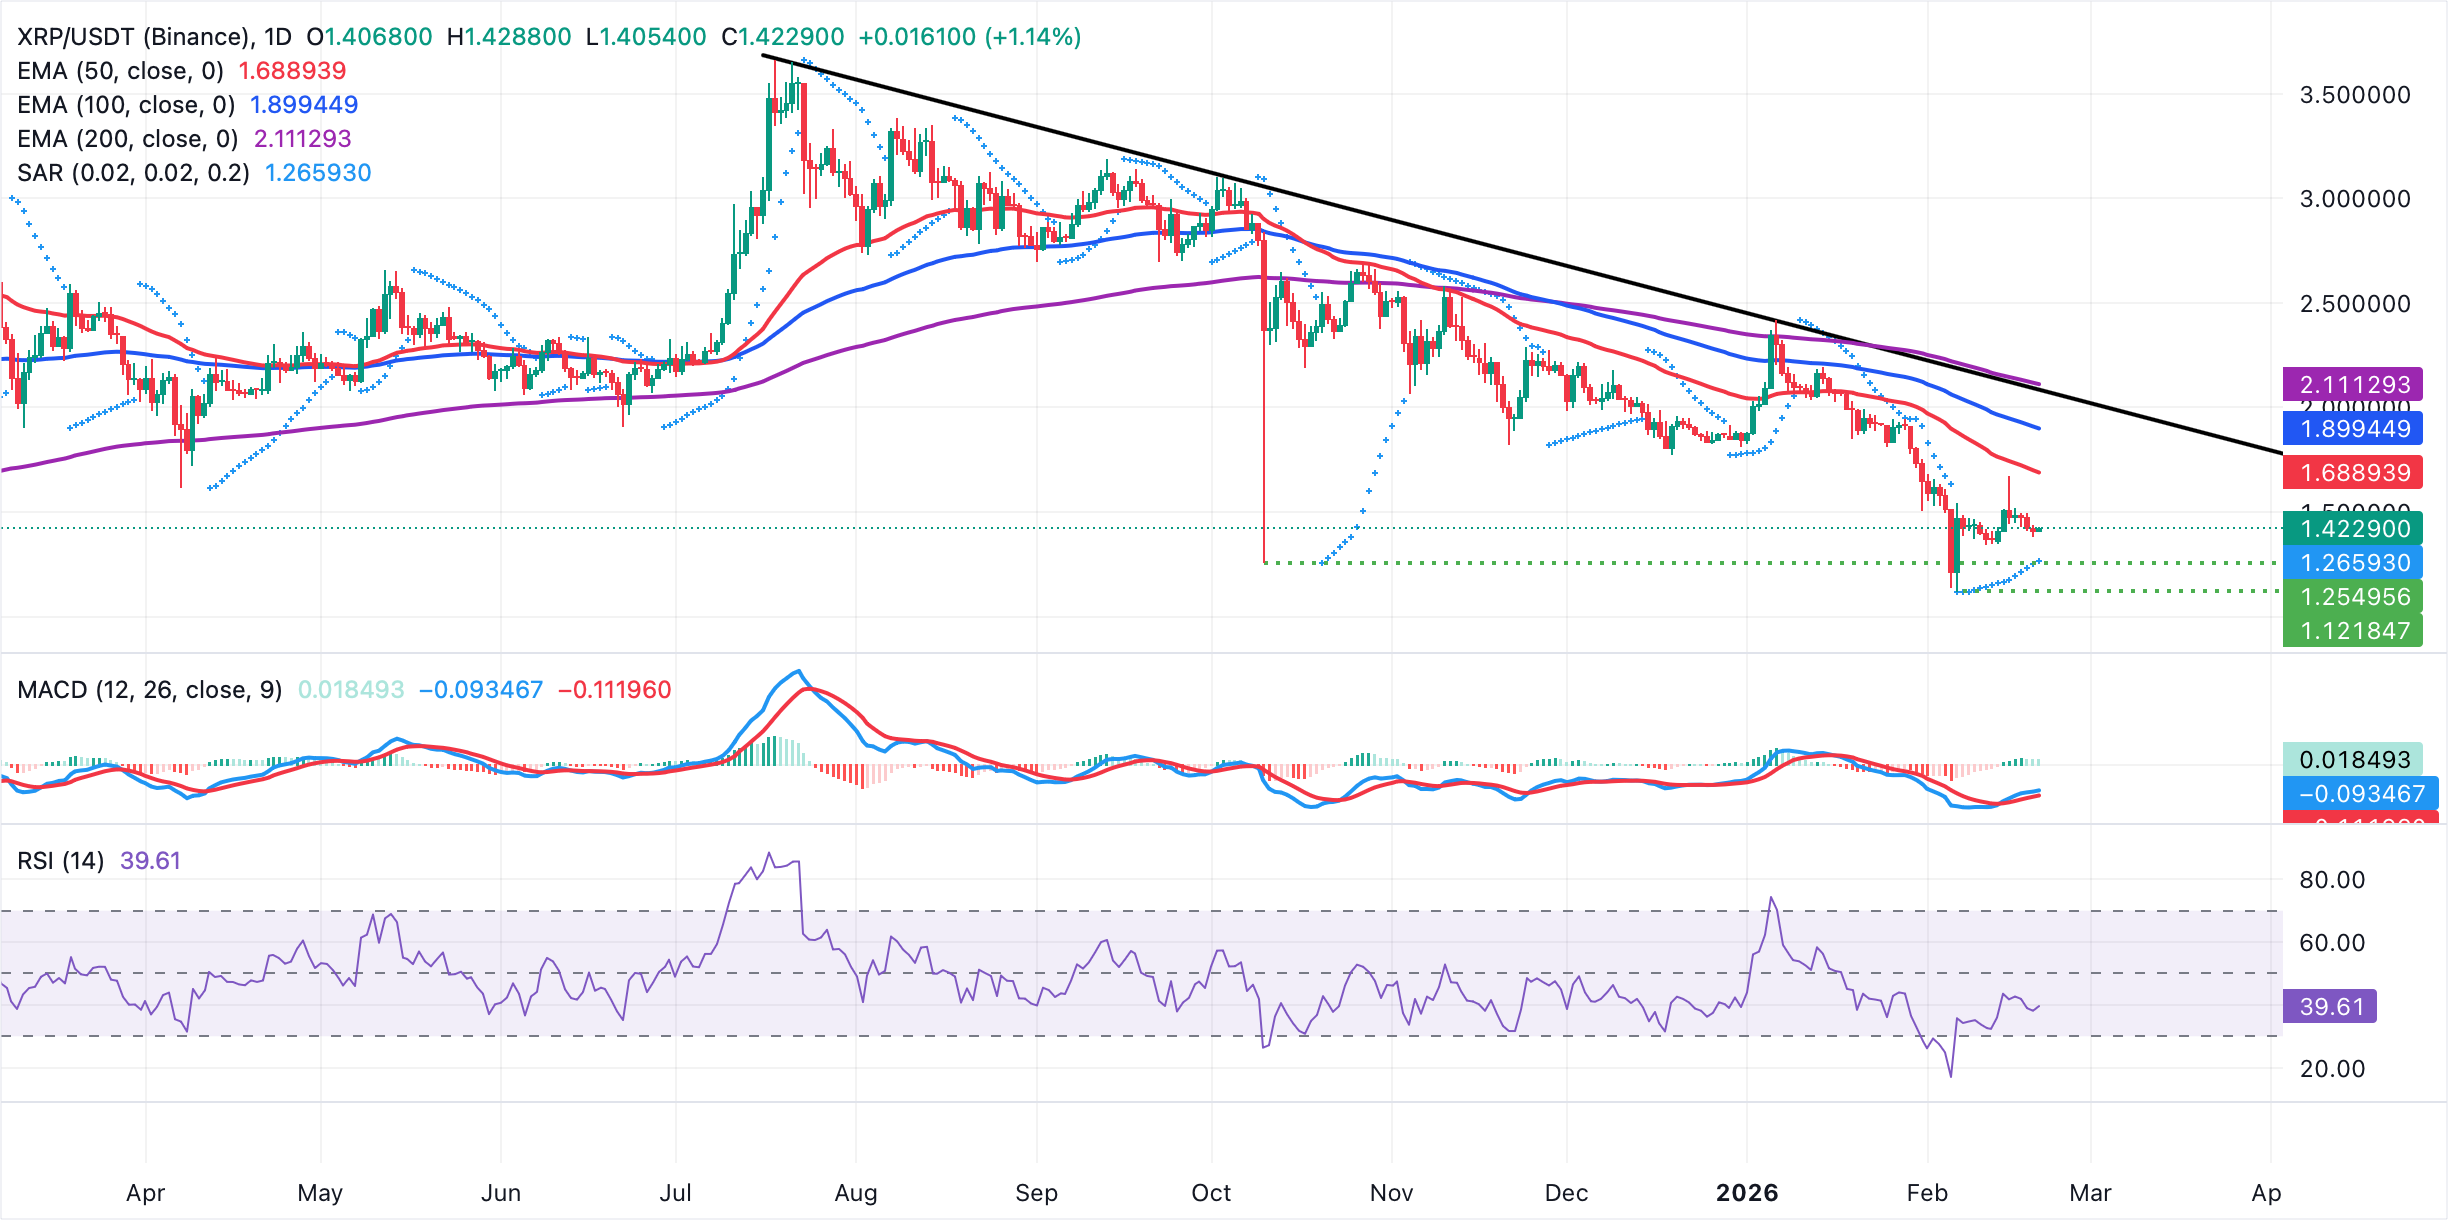
The descending trend line from $3.66 (record high) limits recovery, with resistance at $2.08. Also, the Parabolic SAR holds below the price at $1.26, offering initial support and a reference for trailing stops. A daily close above the trendline hurdle could open room toward the 50-day EMA at $1.69, whereas failure to reclaim it would keep sellers probing the SAR baseline and leave the broader downtrend intact.
Open Interest, funding rate FAQs
Higher Open Interest is associated with higher liquidity and new capital inflow to the market. This is considered the equivalent of increase in efficiency and the ongoing trend continues. When Open Interest decreases, it is considered a sign of liquidation in the market, investors are leaving and the overall demand for an asset is on a decline, fueling a bearish sentiment among investors.
Funding fees bridge the difference between spot prices and prices of futures contracts of an asset by increasing liquidation risks faced by traders. A consistently high and positive funding rate implies there is a bullish sentiment among market participants and there is an expectation of a price hike. A consistently negative funding rate for an asset implies a bearish sentiment, indicating that traders expect the cryptocurrency’s price to fall and a bearish trend reversal is likely to occur.
(The technical analysis of this story was written with the help of an AI tool.)
Author

John Isige
FXStreet
John Isige is a seasoned cryptocurrency journalist and markets analyst committed to delivering high-quality, actionable insights tailored to traders, investors, and crypto enthusiasts. He enjoys deep dives into emerging Web3 tren



