Pi Network Price Forecast: PI recovery stalls amid profit-taking
- Pi Network tests 50-day EMA support on Friday, after a 5% decline the previous day.
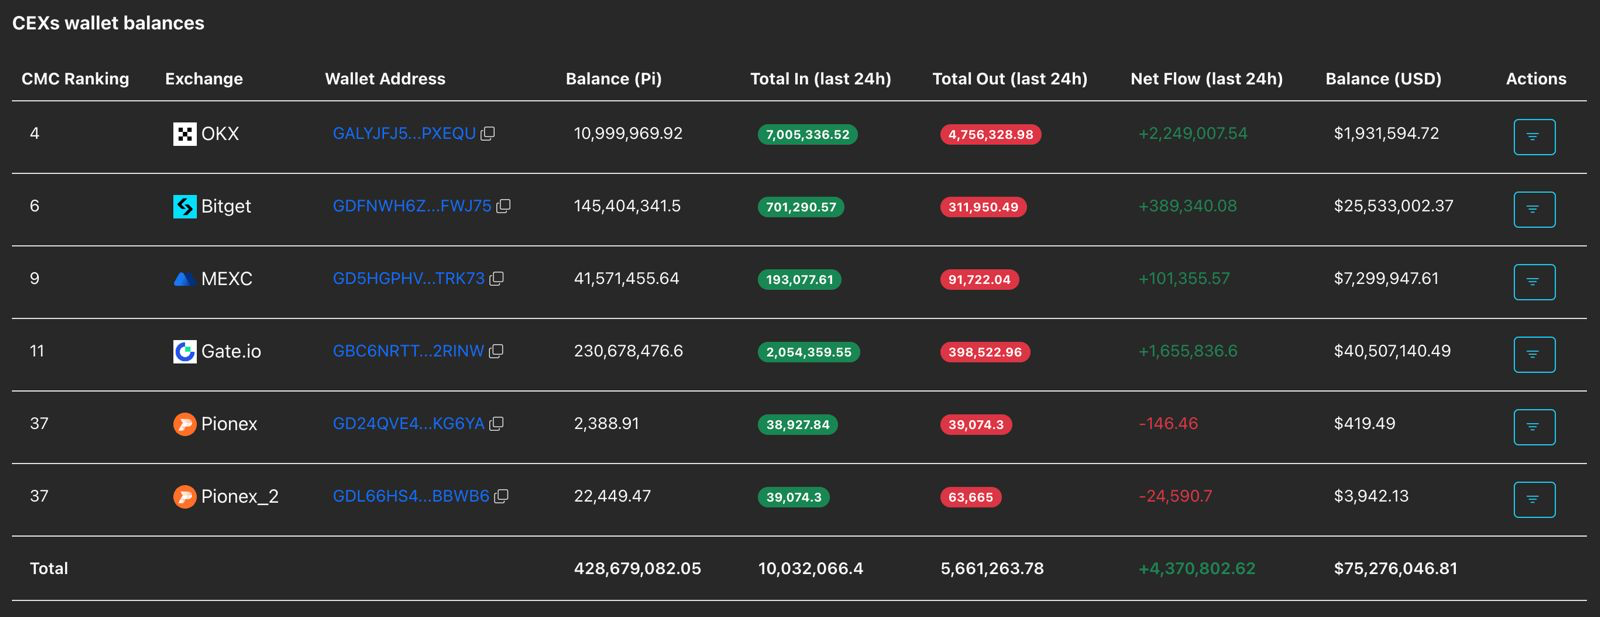
- PiScan data shows large deposits on CEXs totaling over 4 million PI tokens in the last 24 hours, reflecting an exodus of investors taking profits.
- The technical outlook for the PI token turns bearish, as a key resistance level caps the recovery.

Pi Network is trading around $0.1750 at press time on Friday, reversing from a crucial resistance level after a steady recovery earlier this week. More than 4 million PI tokens were deposited on Know-Your-Business-verified (KYB) Centralized Exchanges (CEXs) in the past 24 hours, suggesting a profit-taking phase weighing on the recovery. The technical outlook for Pi Network turns bearish, putting focus on the 50-day Exponential Moving Average (EMA) at $0.1771 as the last line of defense.
Profit-taking begins on PI Open Network’s first anniversary
The retail strength of the Pi Network has been consistently declining, as evidenced by massive user deposits on CEXs. PiScan data shows 4.37 million PI tokens deposited across centralized exchanges over the past 24 hours. This profit-taking phase confirms that the first-anniversary demand has successfully priced in, as previously reported by FXStreet.
Technical outlook: Will PI token decline below its 50-day EMA?
Pi Network started a short-term recovery on February 12, rising roughly 40% within a week to test the $0.1919 resistance level, marked by the October 11 low, on Wednesday. However, the overhead supply pressure capped the recovery run, resulting in a 5% drop on Thursday and creating an evening star pattern that tested the 50-day EMA at $0.1771.
Additionally, the February 15 high at $0.2070 highlights that a resistance trendline connecting the highs of August 30 and November 28 capped the gains.
At the time of writing, Pi Network struggles near the 50-day EMA at $0.177, with downside risk towards the $0.1533 support level looming.
The technical indicators on the daily chart suggest that the buying pressure is waning. The Relative Strength Index (RSI) at 55 consolidates above the midline, suggesting a stagnancy in additional buying pressure. At the same time, the Moving Average Convergence Divergence (MACD) histogram is contracting, implying a potential crossover among the average lines.
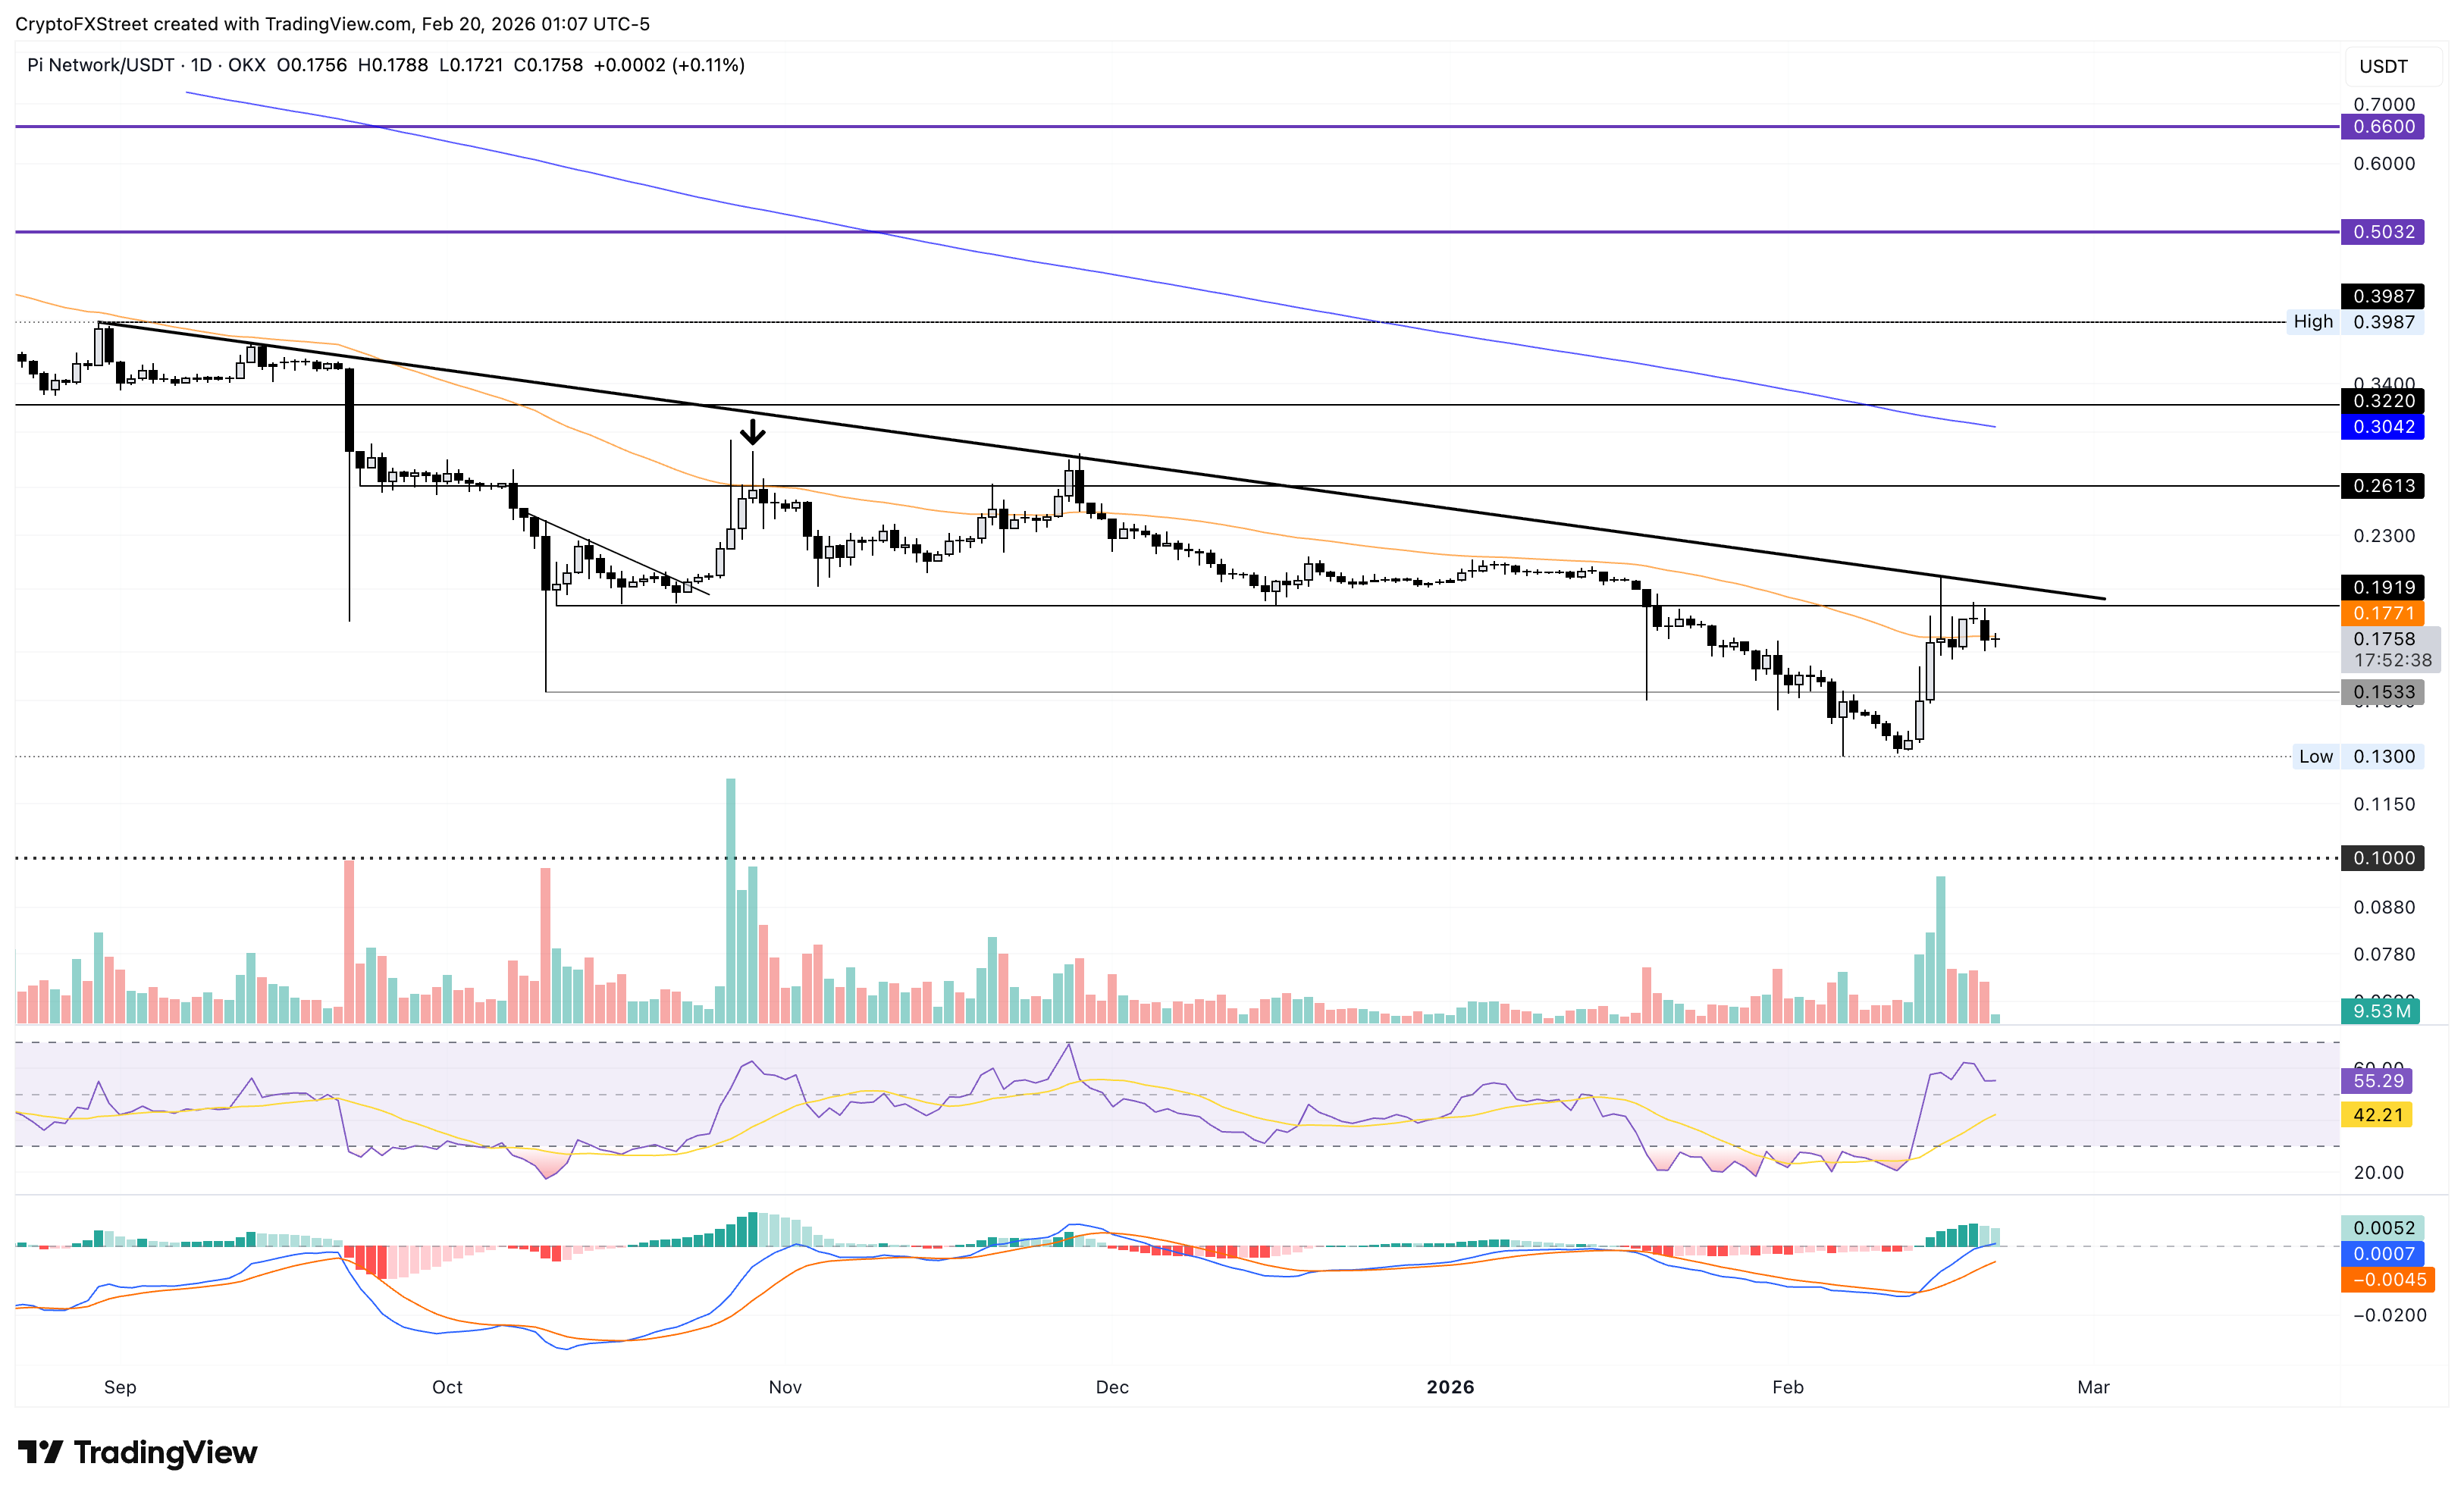
Still, a bounce back from the 50-day EMA crossing above $0.1919 would ease the downside pressure, lifting PI toward the trendline at $0.2000. If Pi Network clears this trendline, it could extend higher toward the September 23 low at $0.2613.
Bitcoin, altcoins, stablecoins FAQs
Bitcoin is the largest cryptocurrency by market capitalization, a virtual currency designed to serve as money. This form of payment cannot be controlled by any one person, group, or entity, which eliminates the need for third-party participation during financial transactions.
Altcoins are any cryptocurrency apart from Bitcoin, but some also regard Ethereum as a non-altcoin because it is from these two cryptocurrencies that forking happens. If this is true, then Litecoin is the first altcoin, forked from the Bitcoin protocol and, therefore, an “improved” version of it.
Stablecoins are cryptocurrencies designed to have a stable price, with their value backed by a reserve of the asset it represents. To achieve this, the value of any one stablecoin is pegged to a commodity or financial instrument, such as the US Dollar (USD), with its supply regulated by an algorithm or demand. The main goal of stablecoins is to provide an on/off-ramp for investors willing to trade and invest in cryptocurrencies. Stablecoins also allow investors to store value since cryptocurrencies, in general, are subject to volatility.
Bitcoin dominance is the ratio of Bitcoin's market capitalization to the total market capitalization of all cryptocurrencies combined. It provides a clear picture of Bitcoin’s interest among investors. A high BTC dominance typically happens before and during a bull run, in which investors resort to investing in relatively stable and high market capitalization cryptocurrency like Bitcoin. A drop in BTC dominance usually means that investors are moving their capital and/or profits to altcoins in a quest for higher returns, which usually triggers an explosion of altcoin rallies.
Author

Vishal Dixit
FXStreet
Vishal Dixit holds a B.Sc. in Chemistry from Wilson College but found his true calling in the world of crypto.



