Chiliz Price Forecast: CHZ extends rally above $0.054 despite on-chain overheating signals
- Chiliz price extends gains, trading above $0.054 on Tuesday after surging over 9% in the previous week.
- Fan Token launches and “Locker Room” growth boost demand, pushing CHZ’s market capitalization above $550 million.
- Traders should be cautious as on-chain data suggests warning signs including rising retail activity, overheating conditions and seller dominance.

Chiliz (CHZ) trades 8% higher at $0.054 on Tuesday, continuing its rally since mid-December. The new launches and developments, such as Fan Token and Locker Room, boosted CHZ demand among investors, pushing its market capitalization to over $550 million. Despite this ongoing rally, traders should be cautious as on-chain data suggests warning signs that could cap further upside.
Fan Token and Locker Room boost CHZ demand
Chiliz continues to expand its Fan Token lineup ahead of the 2026 FIFA World Cup. The CHZ X account posted on Tuesday that Socios has signed a new national football team to launch a Fan Token, following launches for Argentina, Portugal, and Italy, marking the fourth national team. Moreover, engagement within the “Locker Room” remains strong, further strengthening the Chiliz ecosystem.
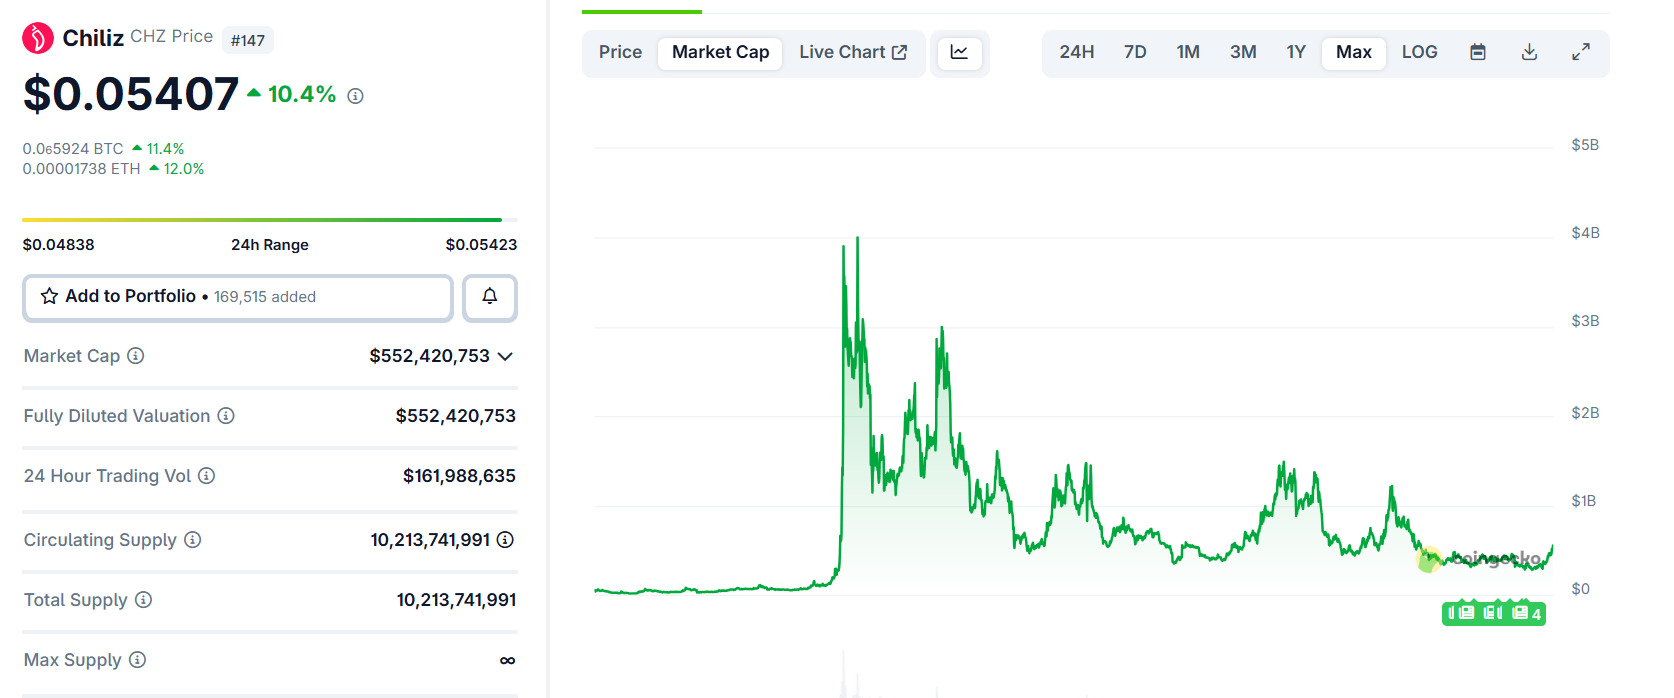
These developments have boosted the demand, pushing CHZ’s market capitalization above $550 million, according to the CoinGecko chart below.
Some signs of concern
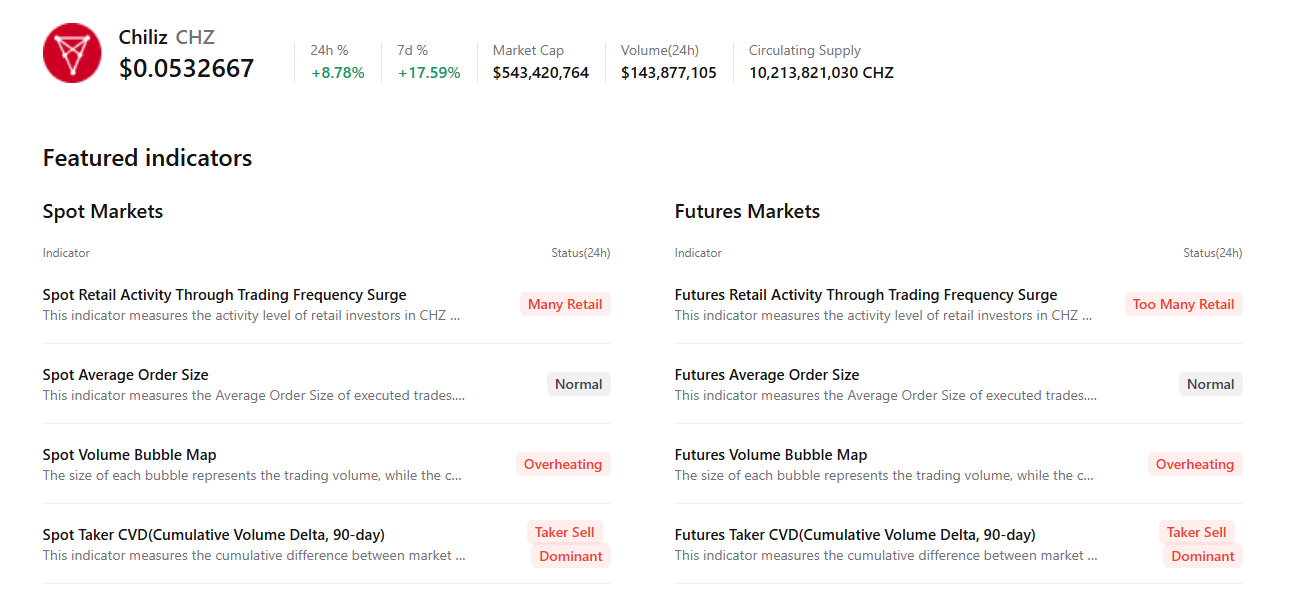
Despite the ongoing price surge, CryptoQuant’s summary data supports a bearish outlook for CHZ. The data indicates that both spot and futures markets show signs of retail activity and overheating, suggesting a potential correction ahead.
Chiliz Price Forecast: CHZ bulls aiming for levels above $0.060
Chiliz price closed above the daily resistance at $0.039 on December 30 and rallied nearly 30% in the next 11 days. However, CHZ encountered slight rejection at the next daily resistance at $0.051 on Sunday and declined slightly. As of Tuesday, CHZ is trading 8% higher, above this resistance level.
If CHZ continues its upward trend, it could extend the rally toward the next weekly resistance at $0.063.
The Relative Strength Index (RSI) on the daily chart is above the 70 overbought level, indicating strong bullish momentum. Moreover, the Moving Average Convergence Divergence (MACD) also showed a bullish crossover, further supporting the bullish view.
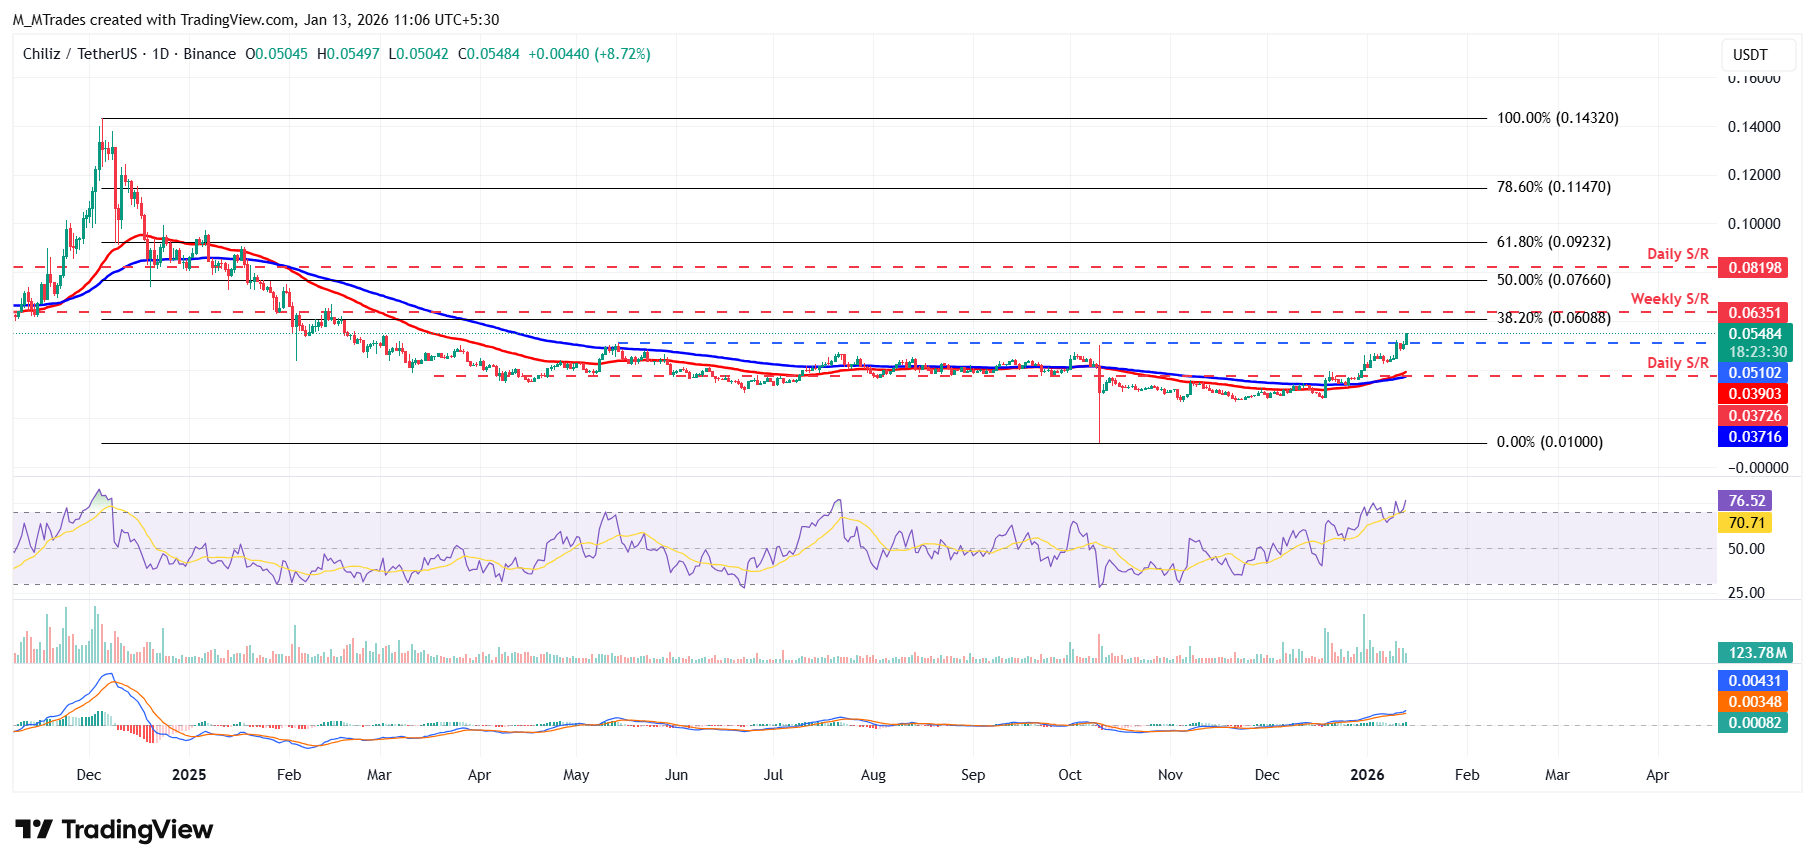
However, if CHZ faces a pullback, it could extend the decline toward the daily support at $0.039.
Author

Manish Chhetri
FXStreet
Manish Chhetri is a crypto specialist with over four years of experience in the cryptocurrency industry.



