|

Zcash Technical Analysis: ZEC/USD pokes through $60 but gets rejected at $61.5

  • ZEC/USD is up 9% in the last 24 hours after climbing above several daily resistances.
  • Zcash has confirmed a daily uptrend.

Zcash is up 200% since March 13 but was slowing down significantly over the past three weeks. ZEC/USD was inside a daily downtrend after losing the 12-EMA and hitting a lower low at $48. On June 22, ZEC had an initial bull surge to $53.62 from a low of $50.3. On June 23, buyers followed up with more strength pushing Zcash above $60, hitting $61.54 before a mild pullback to $58.47.

ZEC/USD daily chart

ZECUSD

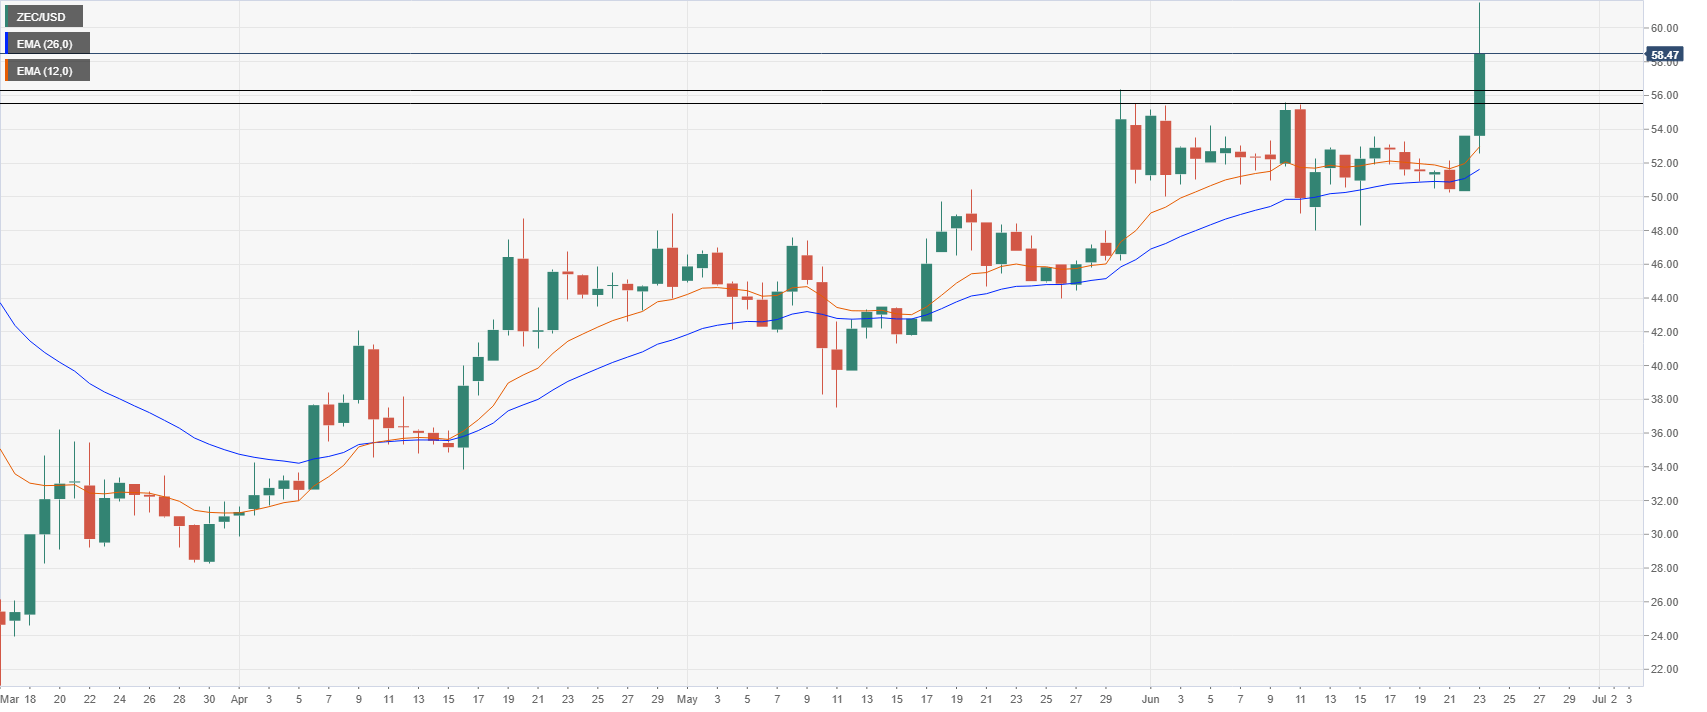
On June 22, buyers pushed Zcash above both daily EMAs which have been bullish for months. On June 23, ZEC climbed above the resistance level at $55.56 and $56.33 and it’s not facing any more resistance until $64.24. 

ZEC/USD 4-hour chart

zecusd

Zcash is also in an uptrend on the 4-hour chart and has a clear path towards $60 and $64. For support, buyers can use the 12-EMA and the previous high of $56.33.

Author

Lorenzo Stroe

Lorenzo Stroe

Independent Analyst

Lorenzo is an experienced Technical Analyst and Content Writer who has been working in the cryptocurrency industry since 2012. He also has a passion for trading.

More from Lorenzo Stroe
Share:

Editor's Picks

Crypto Today: Bitcoin, Ethereum, XRP recovery slows amid incessant capital outflows

The cryptocurrency remains in a broader corrective bias on Friday, despite majors such as Bitcoin (BTC), Ethereum (ETH), and Ripple (XRP) holding slightly higher than early-week support levels.

Cardano: Whale selling, cautious derivatives limit ADA rebound

Cardano is trading near $0.170 at the time of writing on Friday after staging a modest rebound from last week's sharp correction. However, the recovery remains fragile as large holders have resumed reducing their positions, adding fresh selling pressure to ADA.

Experts agree: Bitcoin nears bottom, but weak demand raises doubts

Bitcoin (BTC) is trading above $63,000 at the time of writing on Friday after rebounding from the key 200-week Simple Moving Average (SMA) near $62,000, a level widely viewed as key long-term support.

Pi Network Price Forecast: Bulls attempt comeback as bearish strength fades

Pi Network is trading at around $0.120 on Friday after a modest recovery the previous day. Despite this recent rebound, traders should be cautious as a scheduled unlock of 14.8 million PI tokens on Friday could limit the token's recovery potential by increasing market supply.

Experts agree: Bitcoin nears bottom, but weak demand raises doubts
Bitcoin (BTC) is trading above $63,000 at the time of writing on Friday after rebounding from the key 200-week Simple Moving Average (SMA) near $62,000, a level widely viewed as key long-term support. The recovery may suggest that Bitcoin has found a floor after a sharp correction that spanned more than a month, but some warning signs persist.