XRP price recovers above $0.44 as court ruling approaches, will Ripple win against the SEC?
- Ripple price is trading with a bullish bias as ruling on the SEC case approaches.
- XRP has broken out of a triangle pattern, soaring 4% while eyeing the $0.480 resistance level.
- A daily candlestick close below the $0.443 level would invalidate the bullish thesis.

XRP price has kept its momentum, flashing green on the one-day timeframe as the countdown to the Ripple vs SEC lawsuit continues. The remittance token is moving in tandem with our prediction last week, soaring by a significant margin to secure a place among the best-performing cryptocurrencies on a one-week timeframe.
XRP price breaks out of the triangle pattern
XRP price has soared almost 20% in the last seven days, a move hugely attributed to intensifying chatter around Ripple winning the case against the Securities and Exchange Commission (SEC).
⚠️#RIPPLE VS SEC CASE ENDING IMMINENTLY. PREPARE ACCORDINGLY. #XRP 100% win The case after win #XRP price To much pump pic.twitter.com/Fxq26Td0i3
— BINANCE SPOT AND FUTURES SIGNALS (@binancespotTeam) March 27, 2023
Based on speculation by Crypto Twitter, the court will pass its ruling soon, with all signs pointing to a landmark win for Ripple. Such an outcome would provide clarity for the entire crypto space, and cause a pump in XRP price. John Deaton, a US attorney, has hinted at the same outcome in his latest Twitter post, saying “XRP has the most attractive risk/reward ratio IMO.”
XRP has the most attractive risk/reward ratio IMO. The Judge’s ruling is coming down w/in the next few weeks (maybe this week). If the SEC wins, what’s the downside from .45? Ripple appeals and we get the status quo. Ripple wins and its made clear XRP isn’t a security? Upside?
— John E Deaton (@JohnEDeaton1) March 26, 2023
As a result of the positive chatter, XRP price has escaped from a multi-month triangle, leading the remittance token to reclaim the $0.443 resistance level. An increase in buyer momentum above the latter could see the altcoin shatter past the immediate roadblock at $0.480 to reclaim levels last seen around November 2022, before Sam Bankman-Fried’s crypto empire collapsed.
Further north, XRP price could stretch a leg up to confront the next obstacle at the $0.506 resistance level before tagging the $0.533 barrier in highly bullish cases. Such a move would constitute a 15% increase from current price.
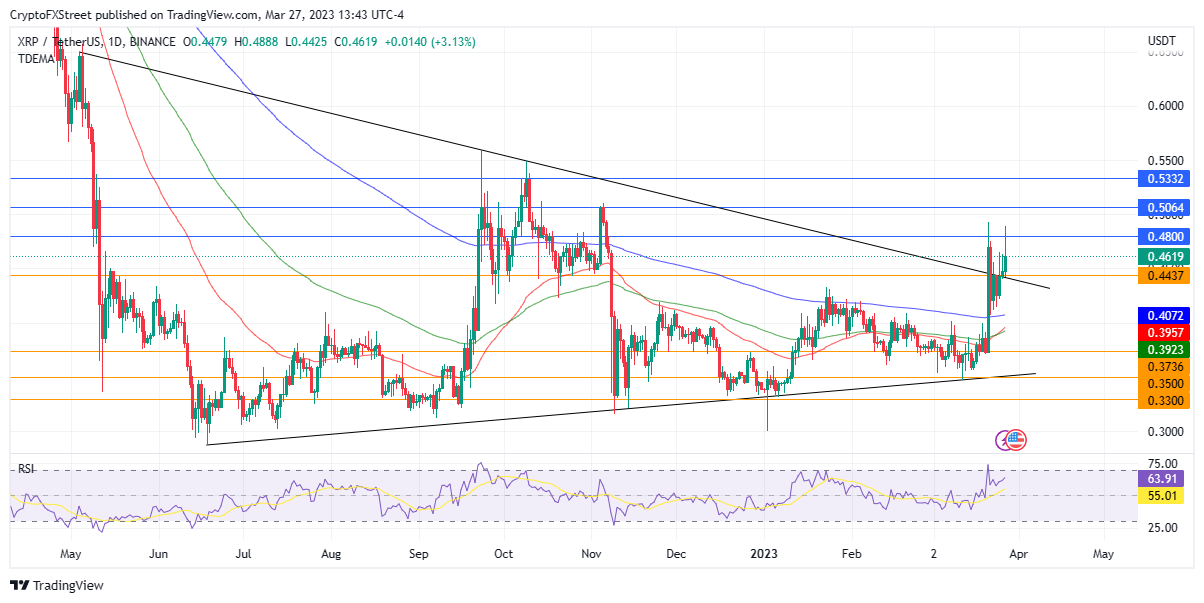
XRP/USDT 1-day chart
Moreover, the Relative Strength Index (RSI) was moving upwards with a price strength of 63. Besides indicating that there was still more room upward, it showed more buyers were buying the token.
Conversely, if profit taking sets in, XRP price could descend, falling back below the descending trendline and resuming the southbound move. A daily candlestick close below the downtrend line at $0.443 could invalidate the bullish thesis.
Such a trajectory could see the XRP price revisit the Exponential Moving Averages, starting with the 200-, 100-, then 50-day EMA at $0.407, $0.395, and $0.392 respectively.
In dire cases, XRP price could move lower to retest the March 21 lows around the $0.392 support level.
The Relative Strength Index (RSI) was moving upwards with a price strength of 63. Besides indicating that there was still more room upward, it showed more traders were buying the token.
Santiment data confirms the bullish case for XRP price
Santiment data has confirmed the positive thesis for XRP price, revealing that the supply of XRP held by addresses with a balance between 10 million and 100 million tokens has risen by over 4% since March 22 (blue). Similarly, the supply of addresses with a balance between one million and 10 million tokens has increased by 1% since March 25 (red).
 [21.23.24, 27 Mar, 2023]-638155449791485129.png)
That shows the XRP whales are stacking up more tokens as the countdown to the court’s decision on SEC vs Ripple's so-called summary judgment narrows.
Conversely, if profit taking sets in, XRP price could descend, falling back below the descending trendline and resuming the southbound move. A daily candlestick close below the downtrend line at $0.443 could invalidate the bullish thesis.
Such a trajectory could see the XRP price revisit the Exponential Moving Averages, starting with the 200-, 100-, then 50-day EMA at $0.407, $0.395, and $0.392 respectively.
In dire cases, XRP price could move lower to retest the March 21 lows around the $0.392 support level.
Author

Lockridge Okoth
FXStreet
Lockridge is a believer in the transformative power of crypto and the blockchain industry.


