XRP price prepares for climb toward $1.11, but Ripple bulls cautiously optimistic
- XRP price has set sights on an 18% bounce following over a week of consolidation.
- The September 29 rally of over 12% was unsustained, but Ripple bulls are not done yet.
- However, only a daily close above $0.95 could see XRP climb toward $1.11

XRP price has sliced above a critical resistance line and is now awaiting an 18% ascent. Ripple needs to close above $0.95 for the bullish momentum to be sustained and its rally toward $1.11 to remain on the radar.
XRP bulls await confirmation
XRP price has quietly burst through the upper boundary of the symmetrical triangle pattern seen on the 12-hour chart. The prevailing chart pattern suggested that Ripple investors were indecisive. However, slicing above the resistance level at $0.95 opened up the possibility of the measured target of an 18% upswing for the token.
The cross-border remittance coin rallied 12% on September 29, although the bears eventually pushed prices lower as Ripple closed below the topside trend line of the governing technical pattern.
In an attempt to press on with the bullish momentum, the buyers are now seeing a slight struggle at $0.95, as this level remains to be a tough nut to crack. Until XRP price is able to slash through this resistance, the bears may continue to have the upper hand.
A daily close above $0.95 could incentivize the bulls to lift prices higher. The next obstacle for XRP price emerges at the 27.2% Fibonacci retracement level at $1.01. Securing a foothold above this price point may see Ripple head toward the 50 twelve-hour Simple Moving Average (SMA), which acts as its next hurdle.
An additional roadblock may appear at the 38.2% Fibonacci retracement level at $1.07 before Ripple is able to tag its optimistic measured target at $1.11, which coincides with the 100 twelve-hour SMA. Further bullish aspirations may see XRP price aim for the 50% Fibonacci retracement level, where the September 9 high sits.
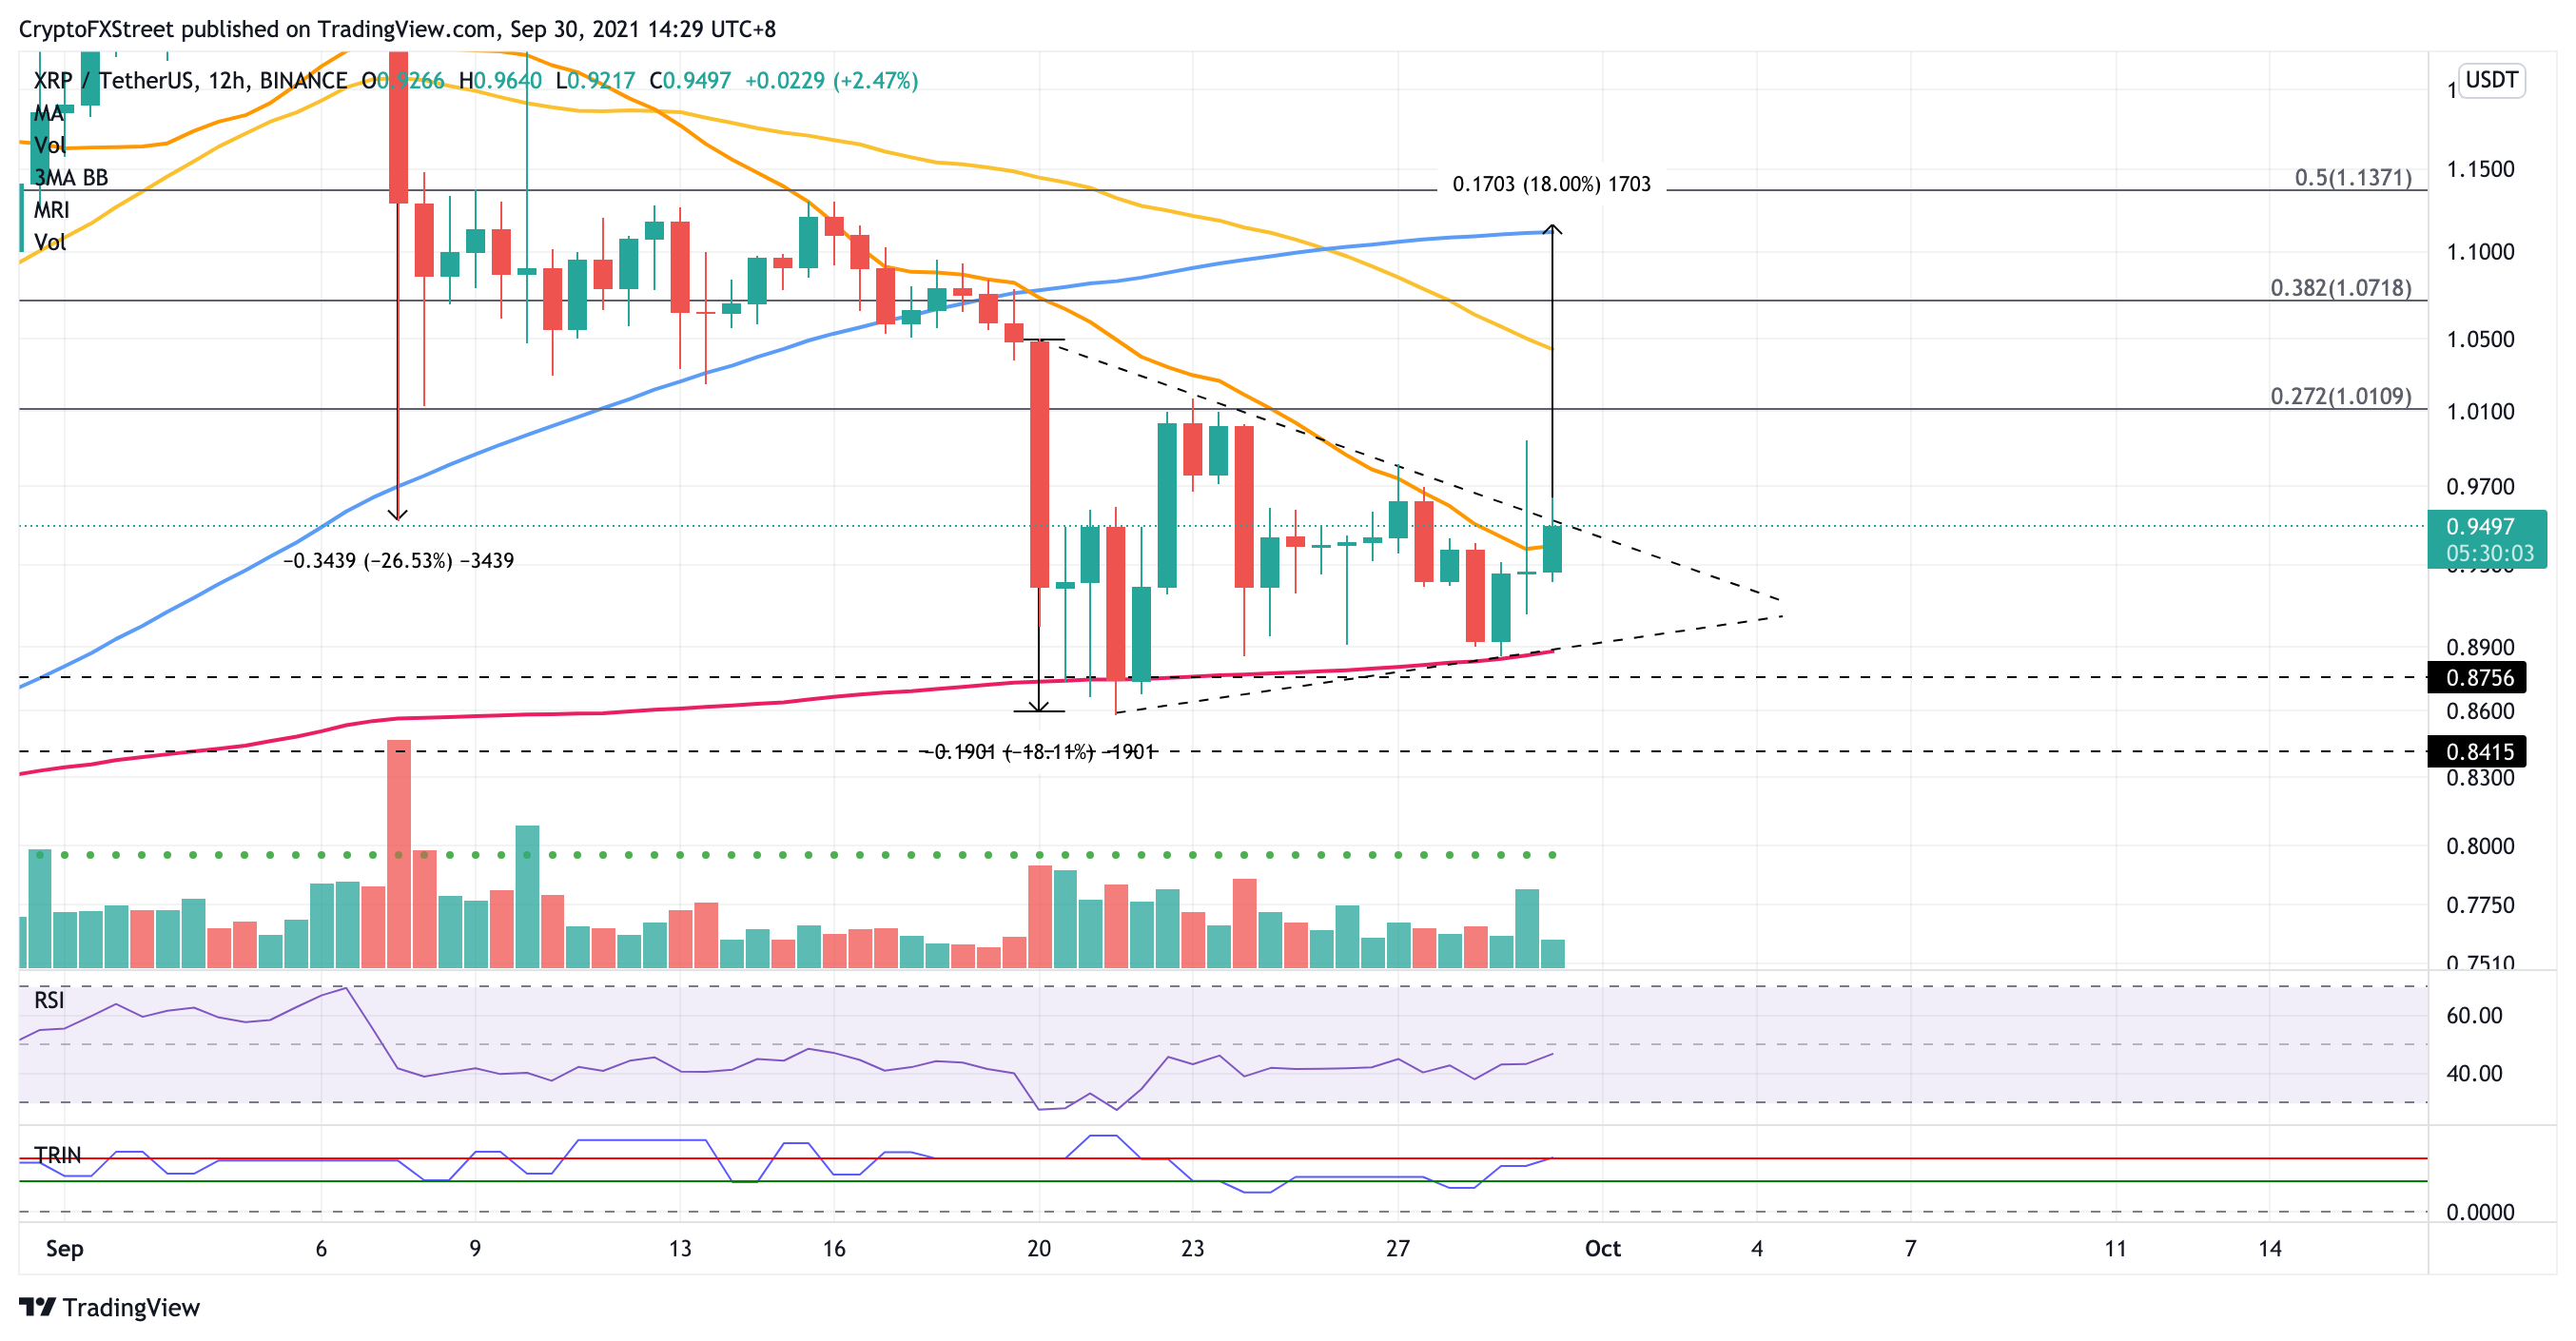
XRP/USDT 12-hour chart
However, investors should be aware of the slightly heightened selling pressure Ripple is facing, which may hinder the asset’s potential rally. The Arms Index (TRIN), which gauges the token’s market sentiment, suggests that there are more sell orders than buy orders in the market.
If the uptrend for XRP price retreats, Ripple may discover immediate support at the downside trend line of the triangle at $0.88, corresponding to the 200 twelve-hour SMA. Should further selling pressure arise, which pushes the token below this foothold, additional lines of defense may emerge at $0.87 and $0.84, the August 11 low and August 8 high, respectively.
Like this article? Help us with some feedback by answering this survey:
Author

Sarah Tran
Independent Analyst
Sarah has closely followed the growth of blockchain technology and its adoption since 2016.