Ripple whales selling $55 million worth of XRP in a month could trigger a decline in XRP price
- XRP price has seen sideways action for the past three days, but indicators suggest the bullishness is waning.
- Ripple whales have been selling for the past month, dumping nearly $55.2 million worth of XRP.
- US SEC is seeking $770 million to settle the lawsuit against Ripple.

XRP price could see an impact of the move its whales are making, which may not be in the favor of investors. Plus, the altcoin is testing a key support level, and by the look of the indicators, a bearish turnout is not out of the realm of possibility.
Daily Digest Market Movers: Ripple whales move to sell
Over the past month, Ripple whales have been moving their holdings, and between September 26 and October 27, the cohort has managed to reduce their balance by 100 million XRP. The addresses holding between 10 million XRP to 100 million XRP have shed about $55 million worth of XRP, bringing their balance down from 5.36 billion XRP to 5.26 billion XRP.
 [19.55.30, 27 Oct, 2023]-638340262560166239.png)
Ripple whale accumulation
XRP price has exhibited a tendency to react according to these addresses' actions in the past – rising when whales accumulate and falling when they sell. Thus, the whales selling their assets hints at potential bearishness wherein the altcoin could decline.
However, a lot of the cryptocurrency’s price action is dependent on the outcome of the Securities and Exchange Commission (SEC) vs Ripple lawsuit. According to long-time Ripple proponent John Deaton, there is a chance that the SEC could decide not to take the case to trial after partially losing the ruling in July.
During a recent discussion with CryptoLaw, Deaton stated that there is a chance that the SEC could resort to settlement. This was followed by him suggesting that for the same, the regulator could demand about $770 million as the settlement amount.
Although this is far from a done deal, a settlement could prevent a decline in XRP price.
Technical Analysis: XRP price to see red
XRP price is trading at $0.550 at the time of writing after posting sideways candlesticks for the past three days. This was preceded by the altcoin noting a 14.77% increase in the span of seven days.
The price indicators are now suggesting that this sideways action could lead to a decline in the cryptocurrency. The Moving Average Convergence Divergence (MACD) indicator exhibits waning bullishness on the histogram, although the signal line (red) has yet to cross over the MACD line (blue).
This occurrence would confirm a bearish crossover, bringing the XRP price to test the support at $0.540, the loss of which would see the altcoin test the 50,100 and 200-day Exponential Moving Averages (EMAs). Falling through them would result in the Ripple token testing $0.505.
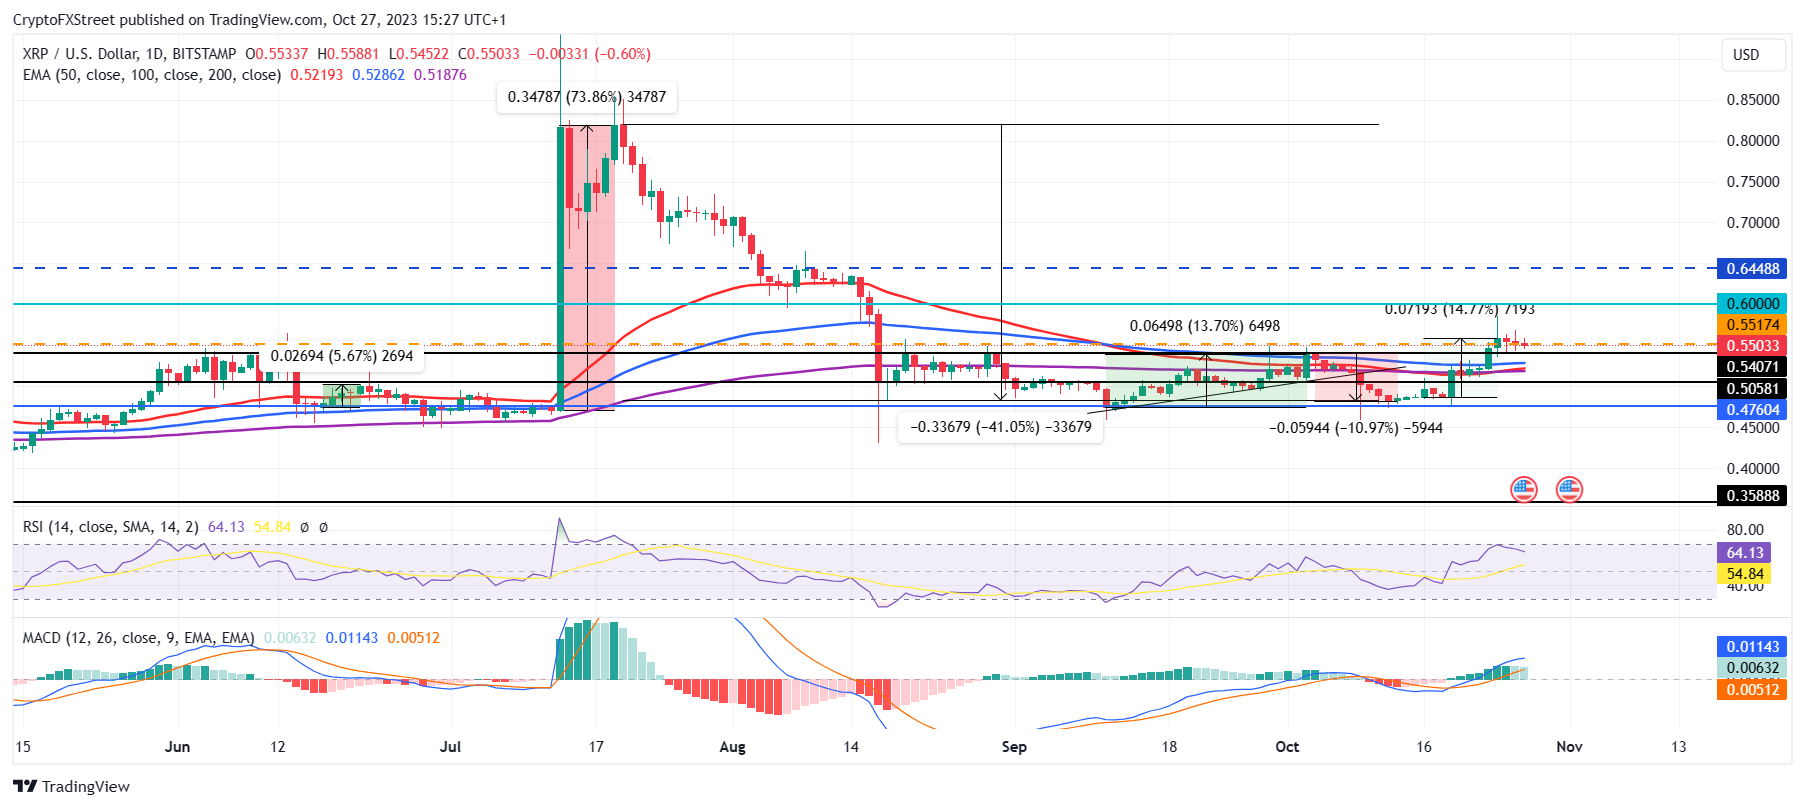
XRP/USD 1-day chart
However, if the broader market bullish cues persist and XRP price bounces back, given the Relative Strength Index (RSI) is still in the bullish zone, it could begin climbing back up. Reclaiming the resistance at $0.600 would be the next target, and flipping it into support would invalidate the bearish thesis completely.
Bitcoin, altcoins, stablecoins FAQs
What is Bitcoin?
Bitcoin is the largest cryptocurrency by market capitalization, a virtual currency designed to serve as money. This form of payment cannot be controlled by any one person, group, or entity, which eliminates the need for third-party participation during financial transactions.
What are altcoins?
Altcoins are any cryptocurrency apart from Bitcoin, but some also regard Ethereum as a non-altcoin because it is from these two cryptocurrencies that forking happens. If this is true, then Litecoin is the first altcoin, forked from the Bitcoin protocol and, therefore, an “improved” version of it.
What are stablecoins?
Stablecoins are cryptocurrencies designed to have a stable price, with their value backed by a reserve of the asset it represents. To achieve this, the value of any one stablecoin is pegged to a commodity or financial instrument, such as the US Dollar (USD), with its supply regulated by an algorithm or demand. The main goal of stablecoins is to provide an on/off-ramp for investors willing to trade and invest in cryptocurrencies. Stablecoins also allow investors to store value since cryptocurrencies, in general, are subject to volatility.
What is Bitcoin Dominance?
Bitcoin dominance is the ratio of Bitcoin's market capitalization to the total market capitalization of all cryptocurrencies combined. It provides a clear picture of Bitcoin’s interest among investors. A high BTC dominance typically happens before and during a bull run, in which investors resort to investing in relatively stable and high market capitalization cryptocurrency like Bitcoin. A drop in BTC dominance usually means that investors are moving their capital and/or profits to altcoins in a quest for higher returns, which usually triggers an explosion of altcoin rallies.
Author

Aaryamann Shrivastava
FXStreet
Aaryamann Shrivastava is a Cryptocurrency journalist and market analyst with over 1,000 articles under his name. Graduated with an Honours in Journalism, he has been part of the crypto industry for more than a year now.


