XRP price personifies lack of momentum and disinterest as SEC v. Ripple drags on
- XRP price has been trying to breach the $0.381 hurdle for roughly 55 days.
- A move out of the consolidation between $0.381 and $0.359 will lead to a directional bias.
- Investors can look to flip long if Ripple retests the $0.340 support level.

XRP price shows clear disinterest among users as the altcoin consolidates. This price action is unlikely to yield any results as long as it remains rangebound.
The US Securities and Exchange Commission (SEC) continues to hold off on divulging documents of William Hinman, the former SEC chairman. Additionally, the regulator took a heavy blow when Magistrate Judge Sarah Netburn granted the defendant’s appeal to not only serve subpoenas to the plaintiff but also authenticate videos of the public remarks made by the agency’s officials.
However, the SEC made a comeback with a one-liner filing that reads,
Plaintiff respectfully takes no position on Defendants’ motion to reopen fact discovery to serve non-party subpoenas for the purpose of obtaining video recordings for authentication.
While the lawsuit drags on, investors and onlookers seem to be losing interest as the remittance token consolidates with no signs of life.
Ripple price remains untradeable
Ripple price has retested the $0.381 hurdle for the 14th day with no signs of directional bias whatsoever. A closer look reveals that the remittance token is hovering between the $0.381 and $0.359 barriers.
Although there was an attempt to move higher on August 17, it failed in a similar fashion to its predecessors. As a result, the remittance token is currently trading at $0.372. A breakdown of the $0.359 support floor will knock XRP price down by 5.3% to retest the $0.340 foothold.
If holders continue to book profits, a sweep of the double bottom formed at $0.326 is likely. With the weakening of the Bitcoin price structure, a minor downswing is what investors can expect for the remittance token.
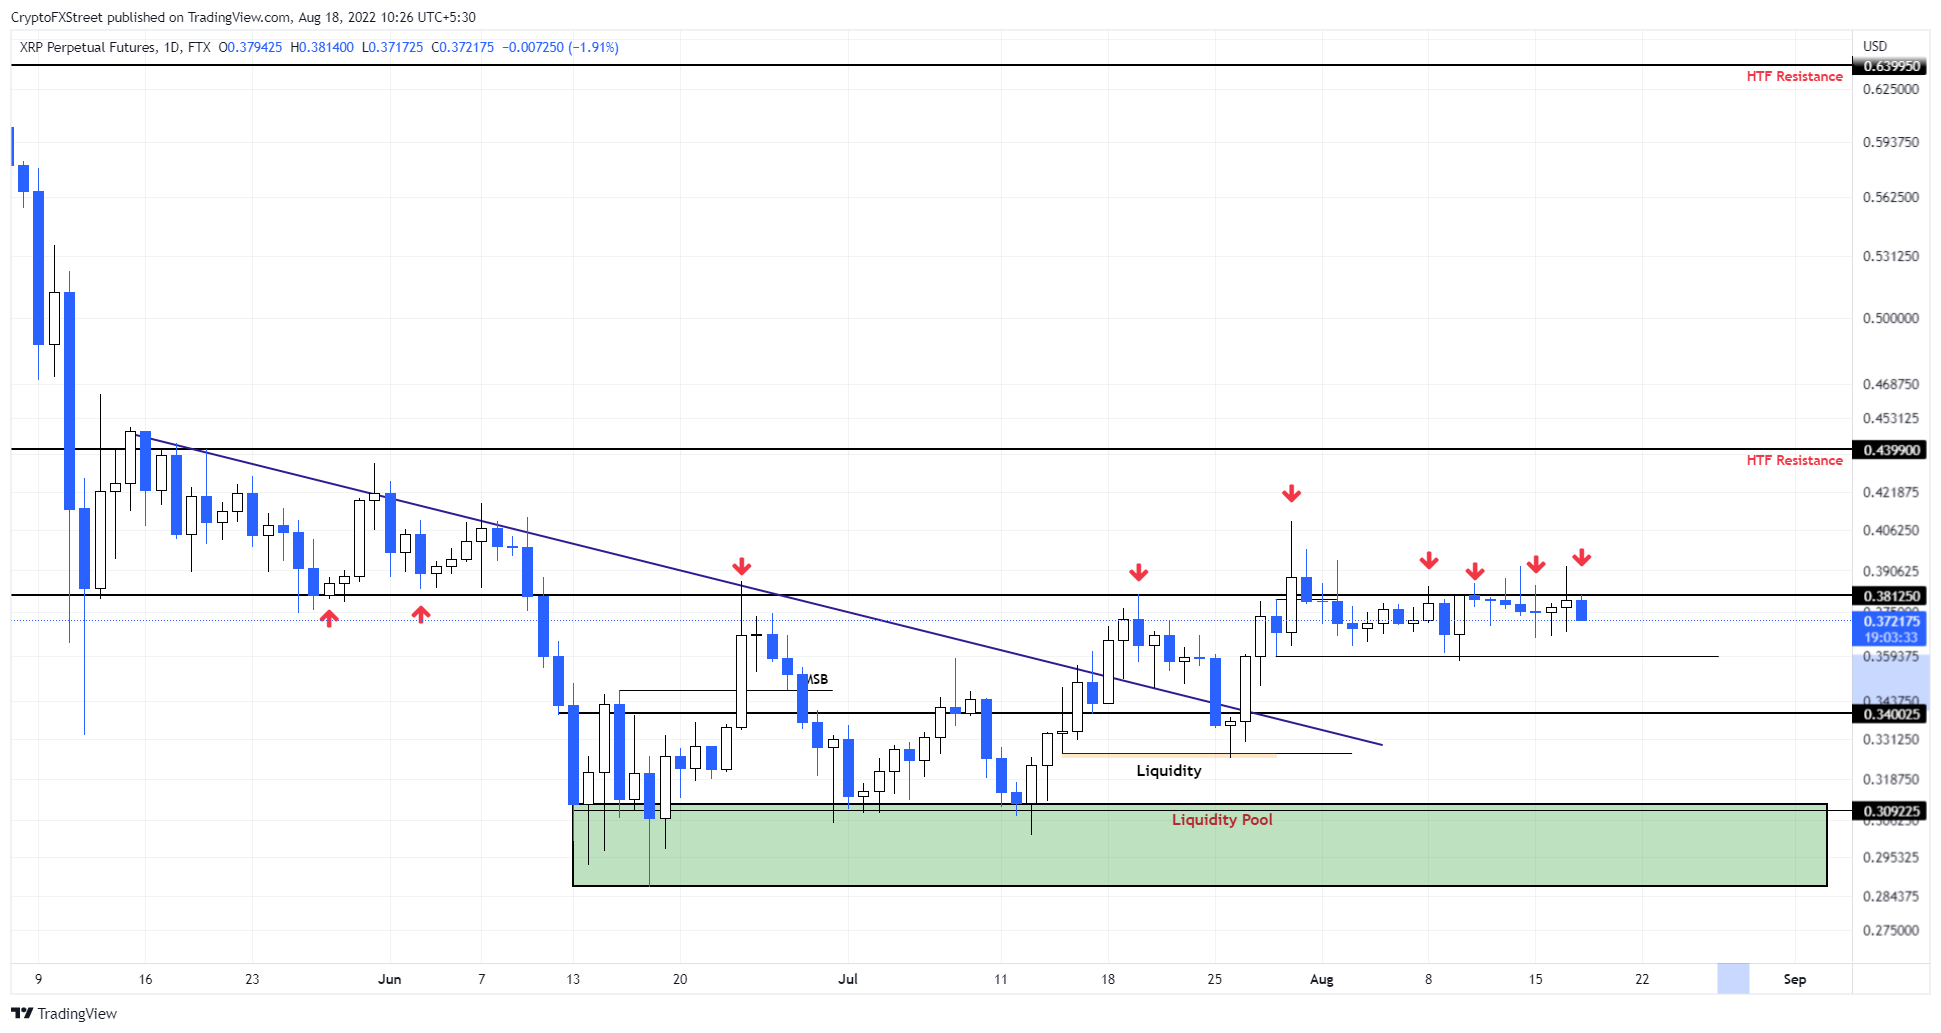
XRP/USD 1-day chart
Due to its consolidation, between the $0.381 and $0.359 barriers, the trading of XRP price is currently not optimal. . As long as the remittance token hovers in this region, there is no major benefit expected from trading it.
However, a breakout or breakdown of one of these levels will confirm the directional short-term outlook for Ripple price. A flip of the $0.381 hurdle into a support floor will trigger a bullish move and will be a cue to look for a move to $0.440.
Author

Akash Girimath
FXStreet
Akash Girimath is a Mechanical Engineer interested in the chaos of the financial markets. Trying to make sense of this convoluted yet fascinating space, he switched his engineering job to become a crypto reporter and analyst.


