Will Solana price sink to $5 as Binance looks to acquire FTX?
- Solana price has formed a head-and-shoulders reversal pattern on the one-week chart.
- This technical formation triggered a breakout that forecasts an 88% crash for SOL.
- Invalidation of the bearish outlook will occur if the altcoin flips the $32.91 hurdle into a support floor on theweekly time frame.

Solana price shows a steep correction that has pushed it below a few critical levels in the last 48 hours. This development has triggered a multi-year bearish outlook that could knock SOL down to single-digit levels.
The underpinning reason for this volatility and sheer bearishness is due to the recent developments between Binance and FTX CEOs, Changpeng Zhao(CZ) and Sam Bankman-Fried (SBF), respectively.
After Coindesk’s initial report and CZ’s comments, the FTX exchange faced massive withdrawals and a liquidity crunch, which eventually led to the two behemoths coming into agreement on a “strategic transaction.”
Although Binance is acquiring FTX, the details of the deals are undisclosed.
1) Hey all: I have a few announcements to make.
— SBF (@SBF_FTX) November 8, 2022
Things have come full circle, and https://t.co/DWPOotRHcX’s first, and last, investors are the same: we have come to an agreement on a strategic transaction with Binance for https://t.co/DWPOotRHcX (pending DD etc.).
Solana price at a crucial stage
Solana price set up a head-and-shoulders setup between April 2021 and August 22. This technical formation contains three peaks resembling the shape of a head and two shoulders. This development represents the end of an uptrend and the incoming of a trend reversal.
The 88% target for this setup is obtained by measuring the distance between the head’s highest point and the neckline, which connects the lowest points of the pattern. Interestingly, the volatility in the second week of Novemberpushed Solana price to break below the neckline, leading to a 36% downswing.
From a purely theoretical standpoint, adding the 88% downswing to the breakout point at $32.18 reveals a target of $3.75. However, the $4.42 support level could cut this downswing short.
Going forward, investors can expect a minor bounce that could propel Solana price to $25. This area is a good place to enter another short position with $15.9 as the target. This level is where the volume profile bulges out, suggesting that there are buyers in the area.
A breakdown of $15.9 could result in a steep correction to the final destination at $4.42,
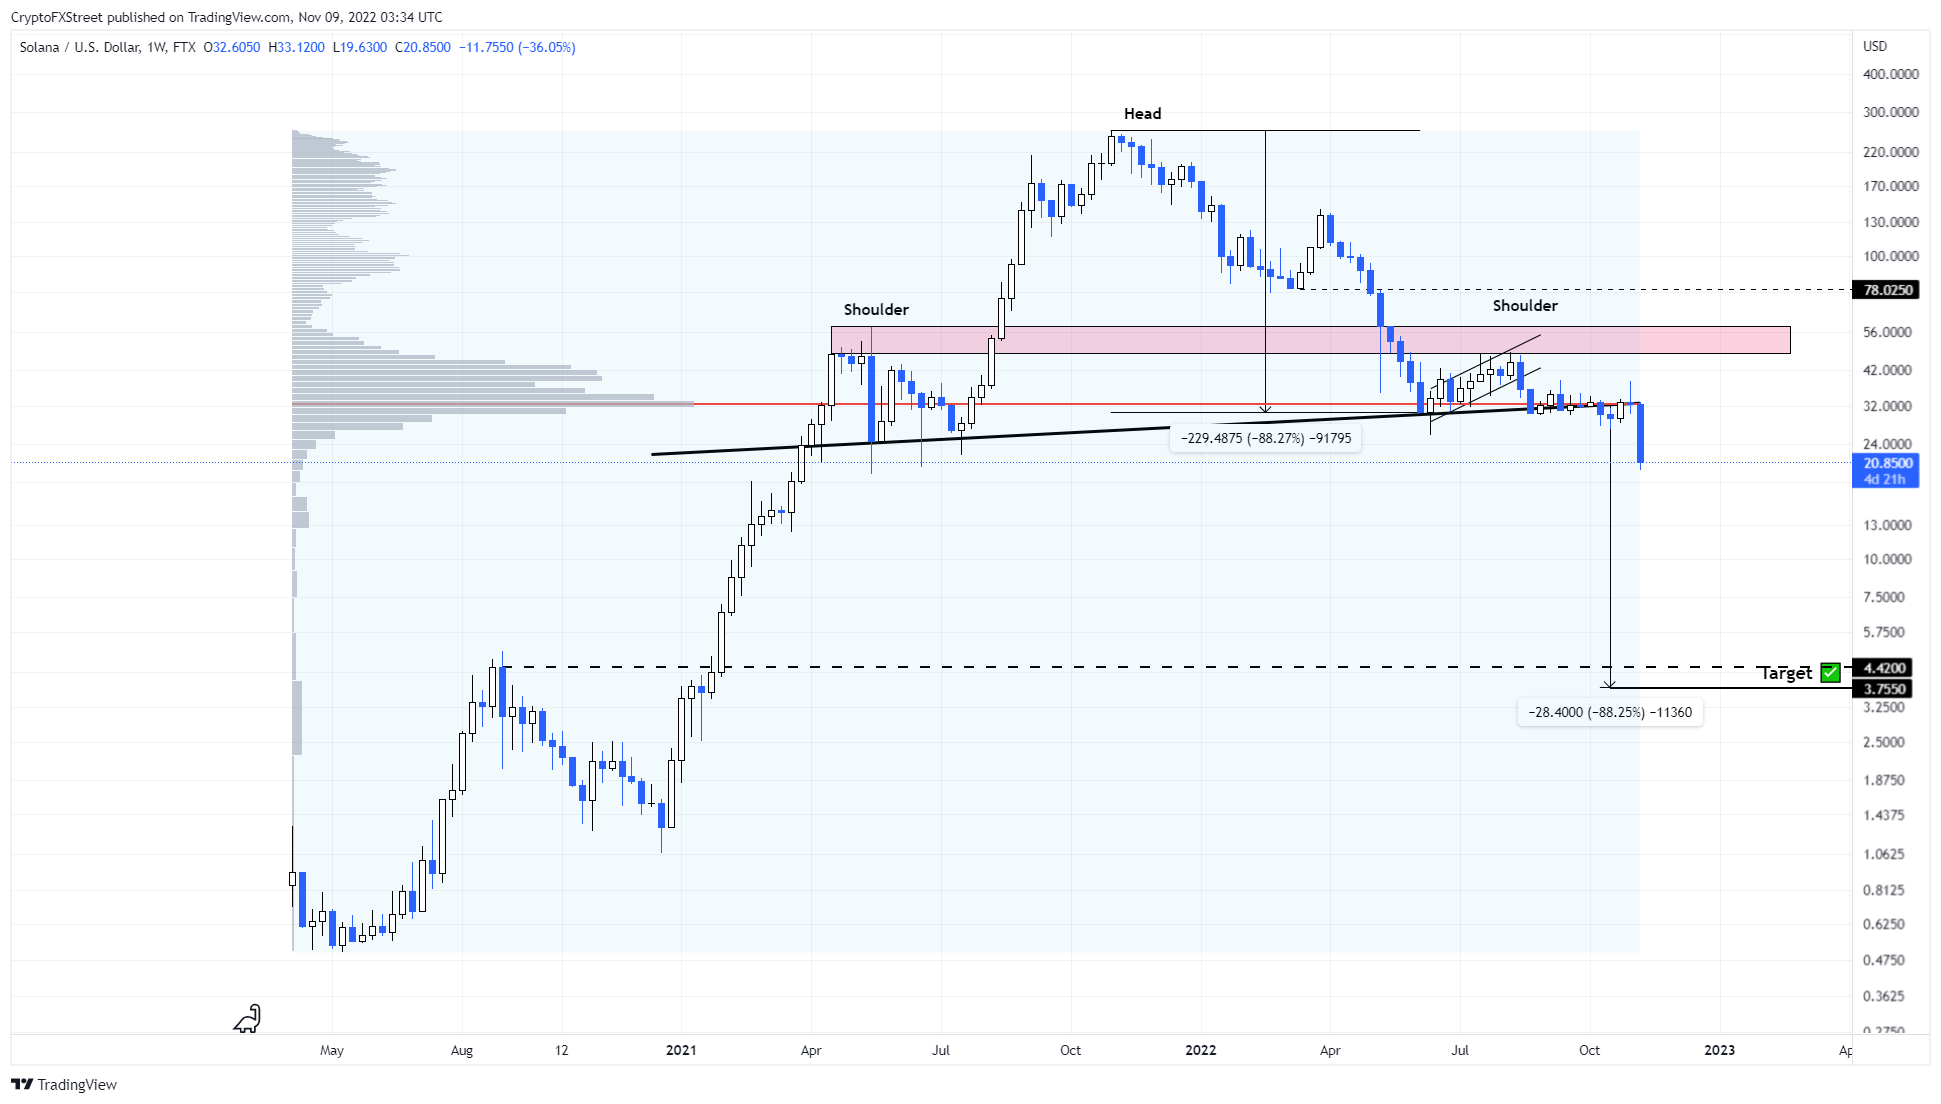
SOLUSDT 1-week chart
While things are looking gloomy for Solana price, the bearish thesis can be invalidated if SOL bulls manage to flip $32.91. This level is the highest volume traded level since April 2020, and a weekly candlestick close above it will resolve the bearish outlook for SOL.
Such a development opens up the bullish path for Solana price to revisit the $47.45 hurdle.
Author

Akash Girimath
FXStreet
Akash Girimath is a Mechanical Engineer interested in the chaos of the financial markets. Trying to make sense of this convoluted yet fascinating space, he switched his engineering job to become a crypto reporter and analyst.


