Will MATIC price conquer the bullish target of $2 again?
- MATIC recovered from its recent pullback and made a comeback to stable support at $1.11.
- The Ethereum scaling solution token needs to overcome the supply wall between $1.15 to $1.31 to begin a new uptrend in its rally.
- Nearly 45,300 addresses hold over 1.5 billion MATIC tokens at the supply wall, making it key to Polygon’s native tokens price rally.

MATIC, the native token of the Ethereum scaling solution Polygon conquered a key support level, resuming its uptrend. The token decoupled from Bitcoin over the past week, the correlation dropped to levels previously seen in February 2023.
With Polygon’s developmental updates, launch of zkEVM mainnet beta the $2 psychological target is back in play for Ethereum’s largest scaling solution token.
Also read: Why exchange tokens Uniswap, Synthetic and Thor are rallying despite regulatory hurdles
MATIC price uptrend is supported by these on-chain metrics
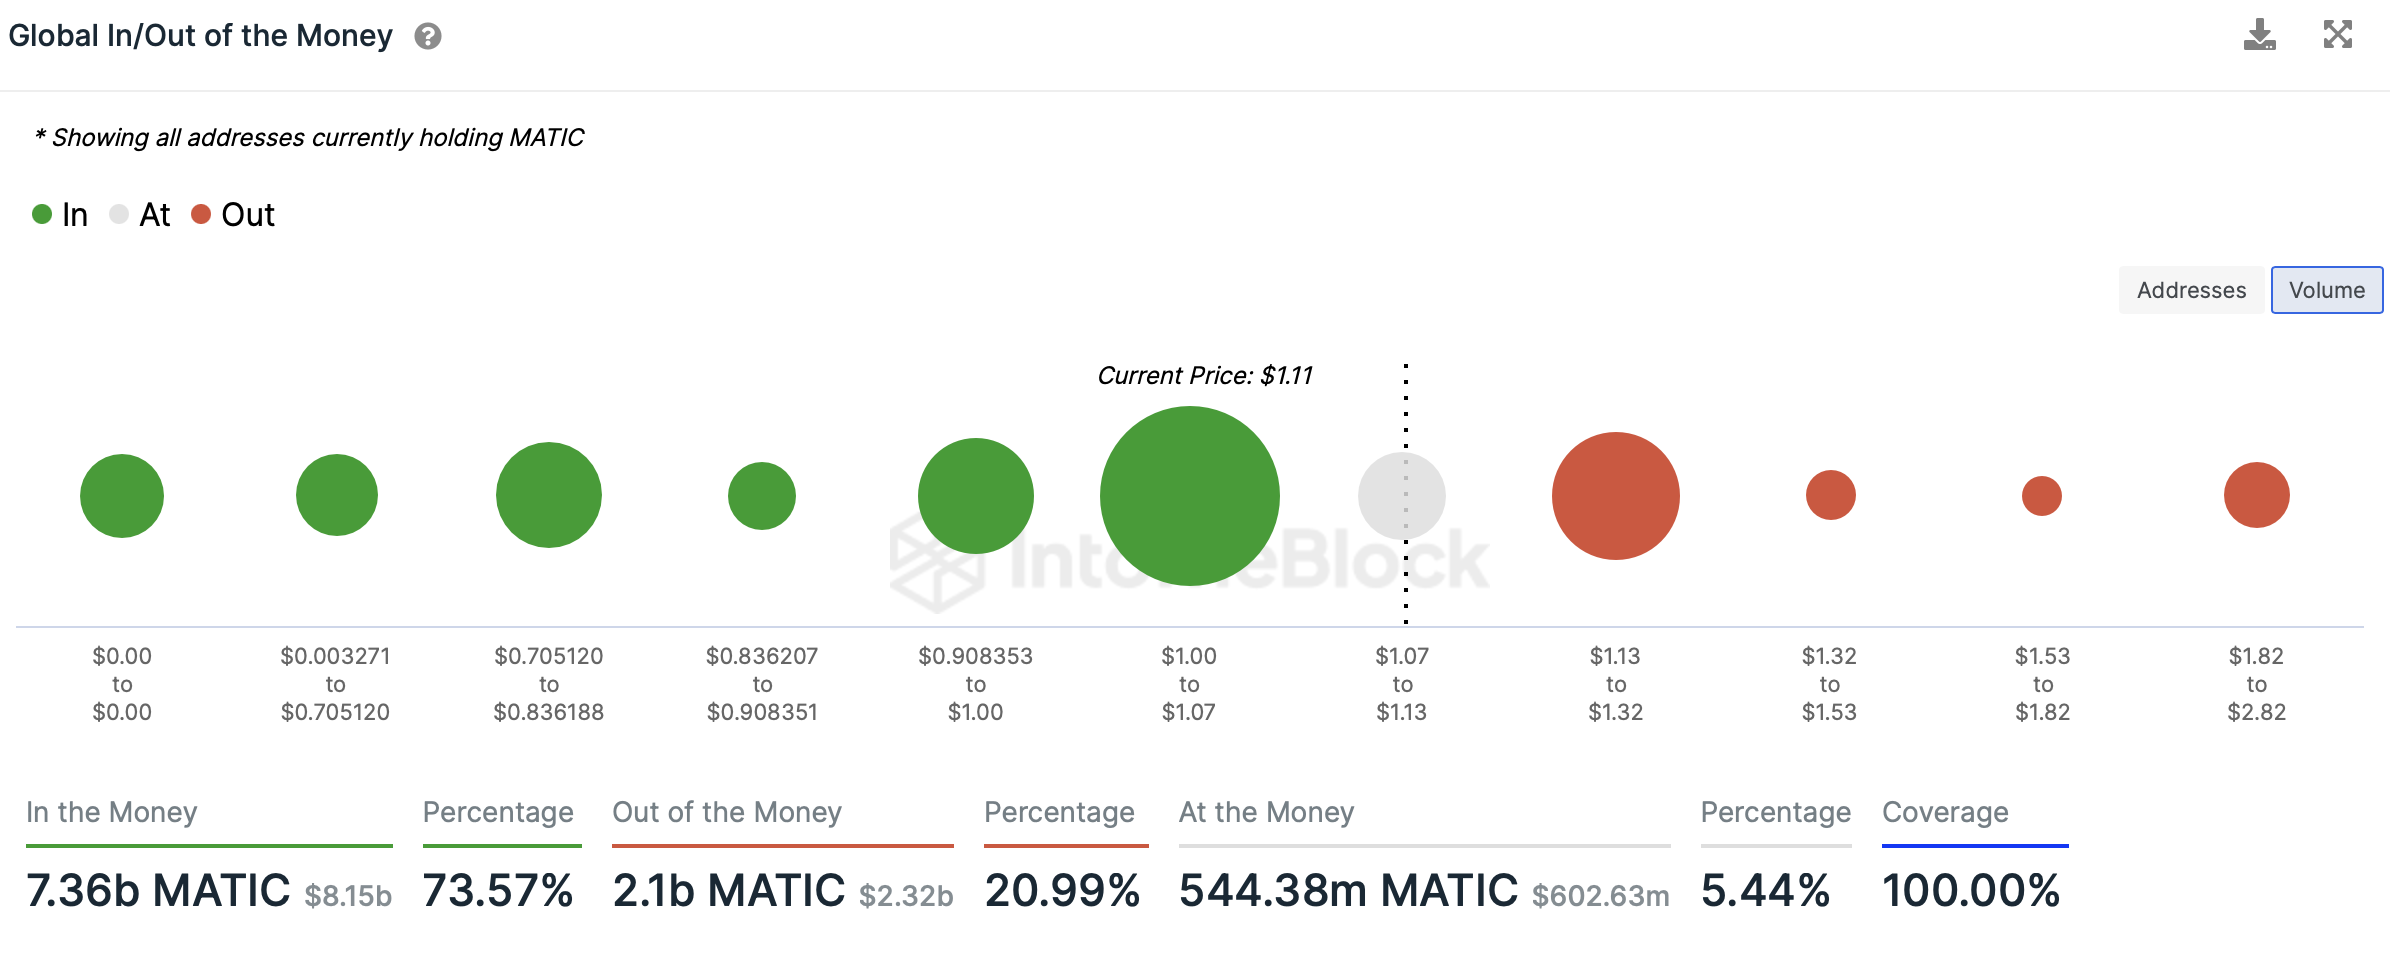
On-chain data from crypto intelligence trackers Santiment and IntoTheBlock indicates MATIC price is above a crucial support level. MATIC price climbed to $1.11, conquering the support wall between $0.99 and $1.08 where 28,500 addresses bought 4.10 billion tokens.
MATIC needs to overcome the next supply wall between $1.51 to $1.31 for its price rally. Nearly 45,300 wallet addresses holding upwards of 1.5 billion MATIC acquired in this price range.
MATIC key support levels
MATIC network’s large wallet investors continued accumulation of the Layer 2 token, since March 19, 2023 as seen in the chart below.
%20[17.47.24,%2001%20Apr,%202023]-638159504667530598.png)
MATIC accumulation by whales
Whale accumulation is typically considered a bullish sign for the asset.
What are the hurdles in MATIC price rally to $2
MATIC faces competition from other Ethereum Layer 2 scaling tokens. At the same time, as seen in the MATIC/USDT one-day price chart below, MATIC price is currently in a support zone.
Polygon’s native token needs to conquer the support zone and rally above $1.30, to face resistance at the 38.2% Fibonacci Resistance at $1.31. There is a key resistance zone between $1.35 and $1.46, this is crucial to MATIC’s rally to $2, since the last time the Layer 2 token hit its bullish target of $2 this is where it battled resistance.
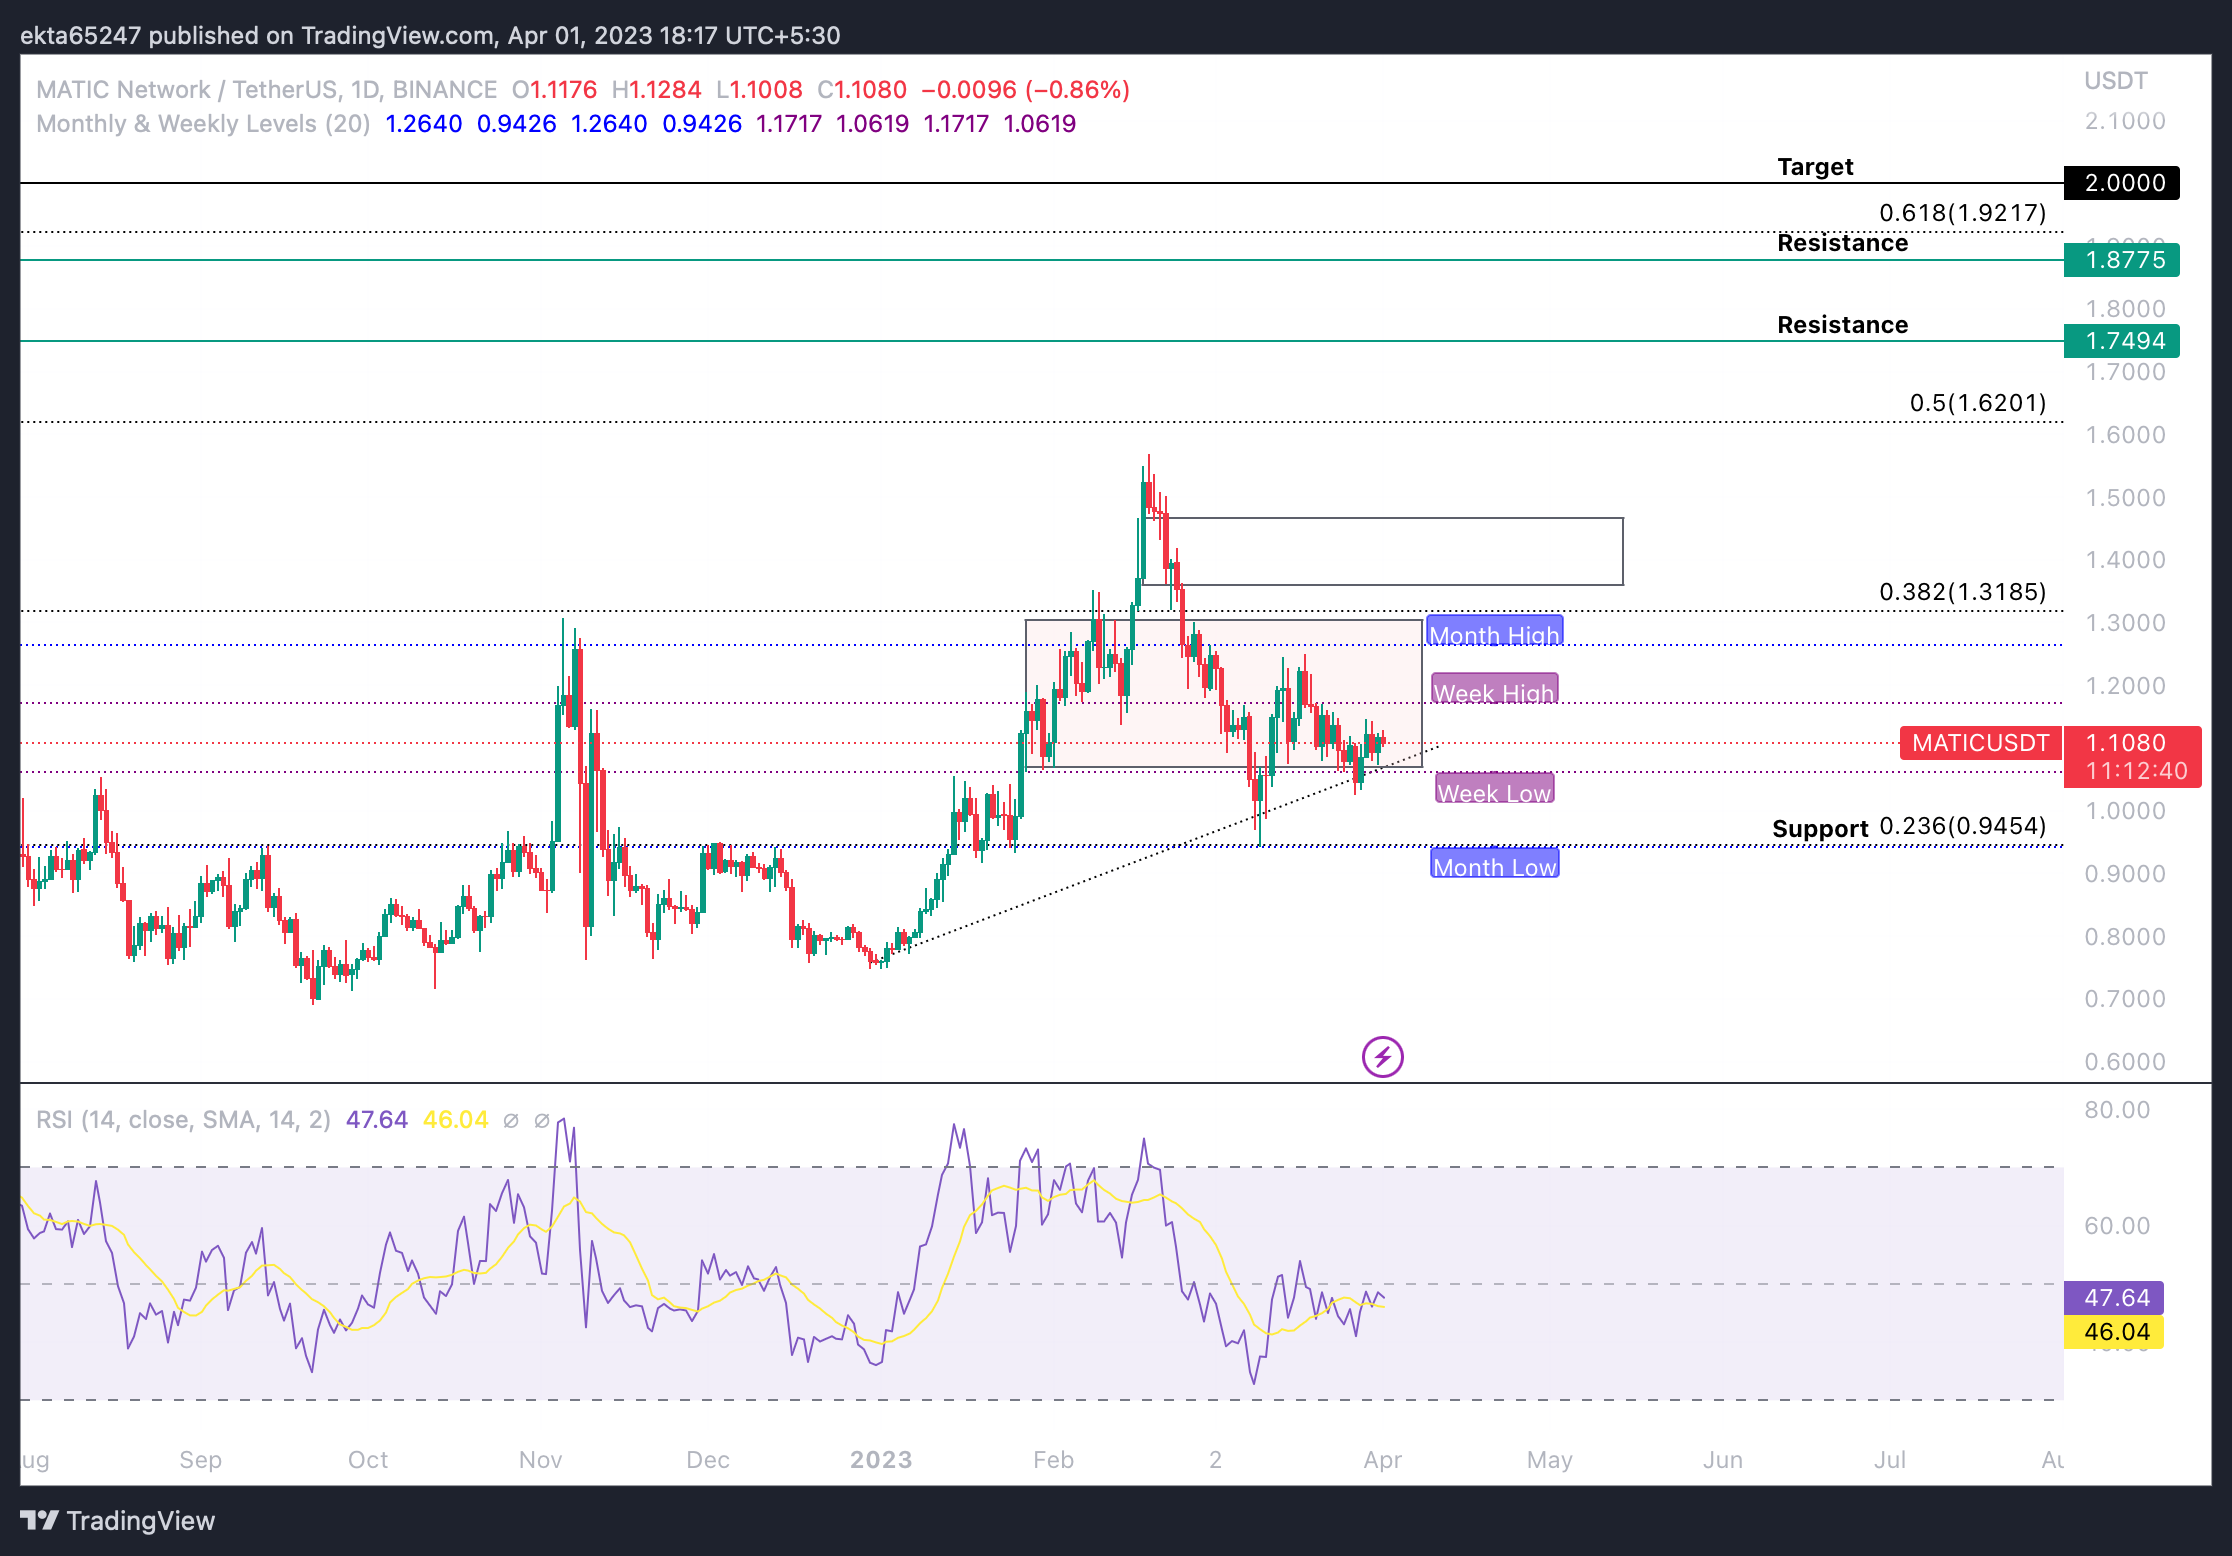
MATIC/USDT 1D price chart
As seen in the chart above, beyond the resistance zone, the next set of resistances are at the 50% Fibonacci Retracement, $1.74 and $1.87, two levels that acted as resistances in MATIC’s previous run up to $2.
In the event that the bullish thesis is invalidated, the Layer 2 token could find support at the monthly low, that coincides with the 23.6% Fibonacci Retracement level at $0.94.
Author

Ekta Mourya
FXStreet
Ekta Mourya has extensive experience in fundamental and on-chain analysis, particularly focused on impact of macroeconomics and central bank policies on cryptocurrencies.


